Exports
In addition to the automatized dashboard notification, there are various ways to manually export data from AgrEGG.
Excel Export
The easiest way is to export data in Excel format.
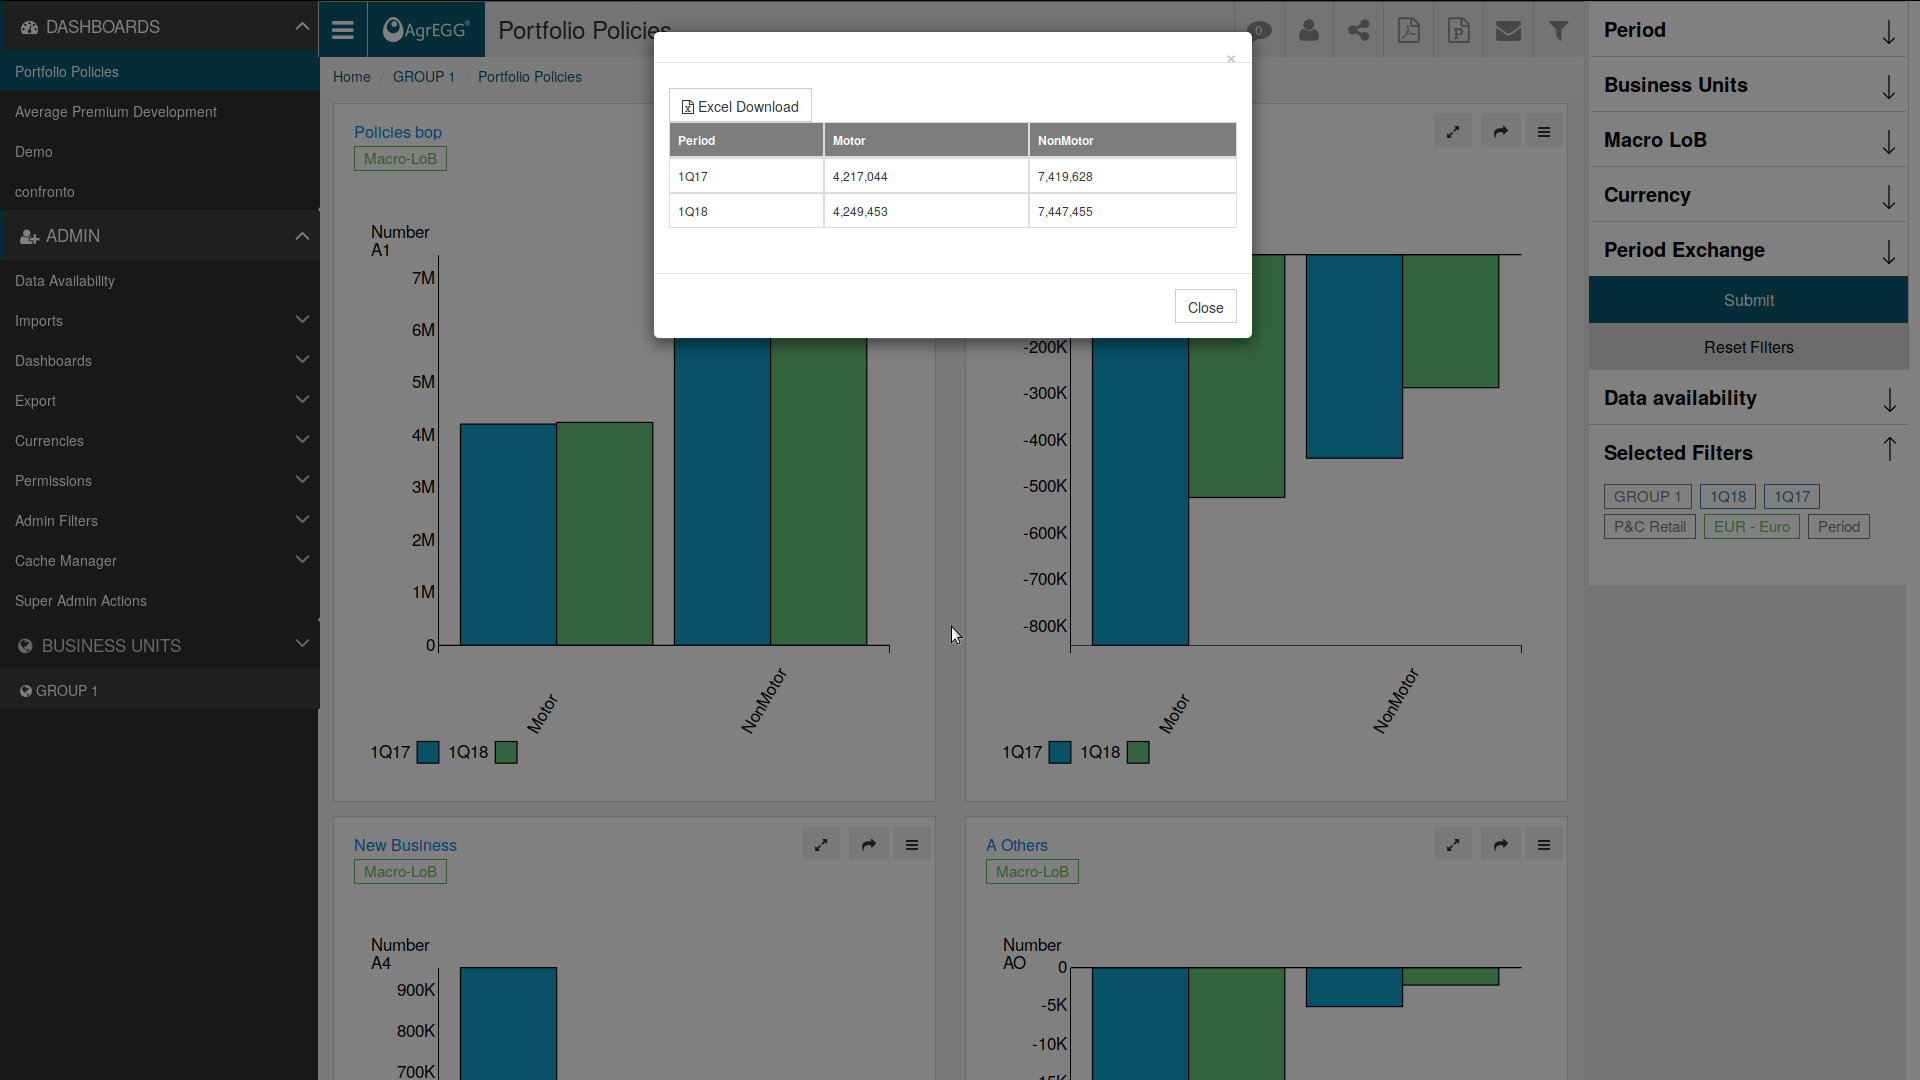
Over tables you can find the button “Excel Download”. Click it to download the content of the table.
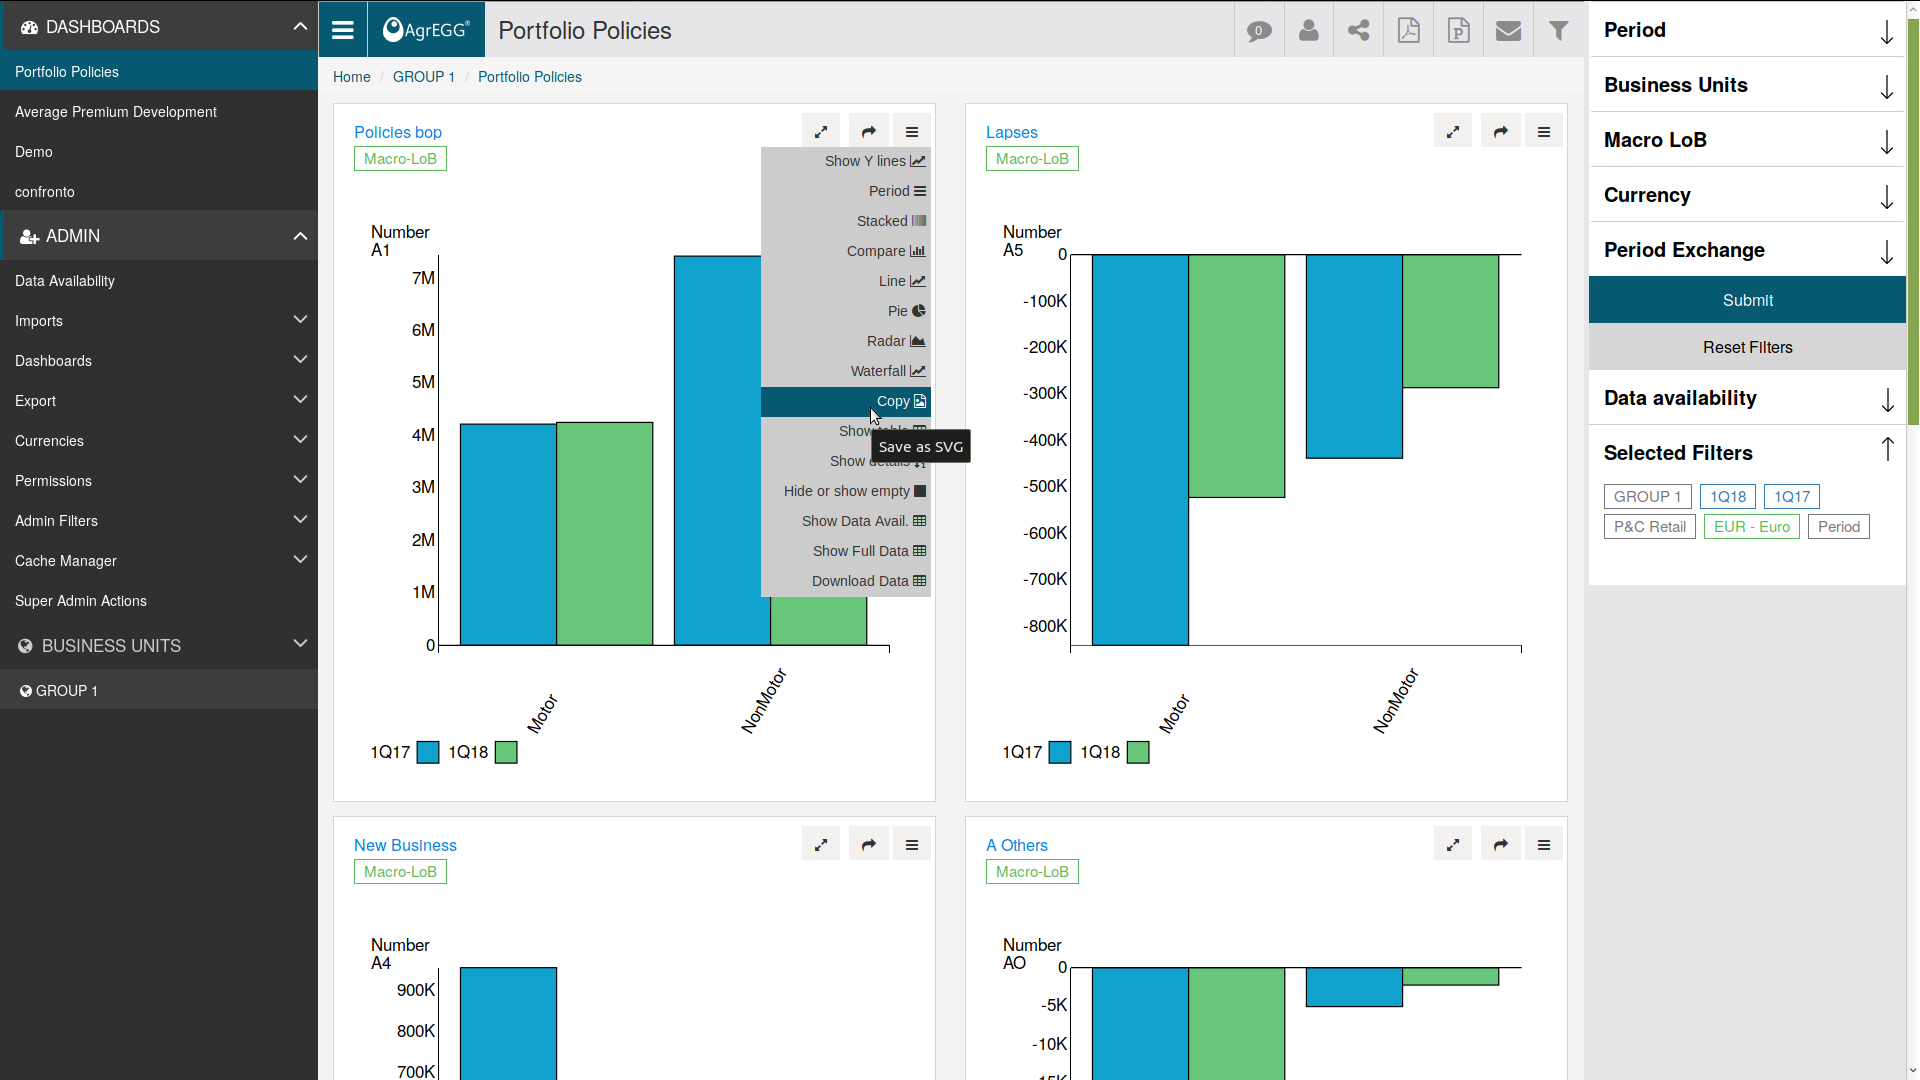
Similarly, click on the button with three lines in plots, then select “Download Data”, and finally “Excel Download” to download the data from which the plot is built.
EMF/SVG Export
It is possible to download a plot in vectorial form, via the function “Copy”, after clicking on the button with three lines on top of the plot itself. At this point the object can be directly pasted in another program, or downloaded as a file with “More” and then “Save EMF”.
PDF Export
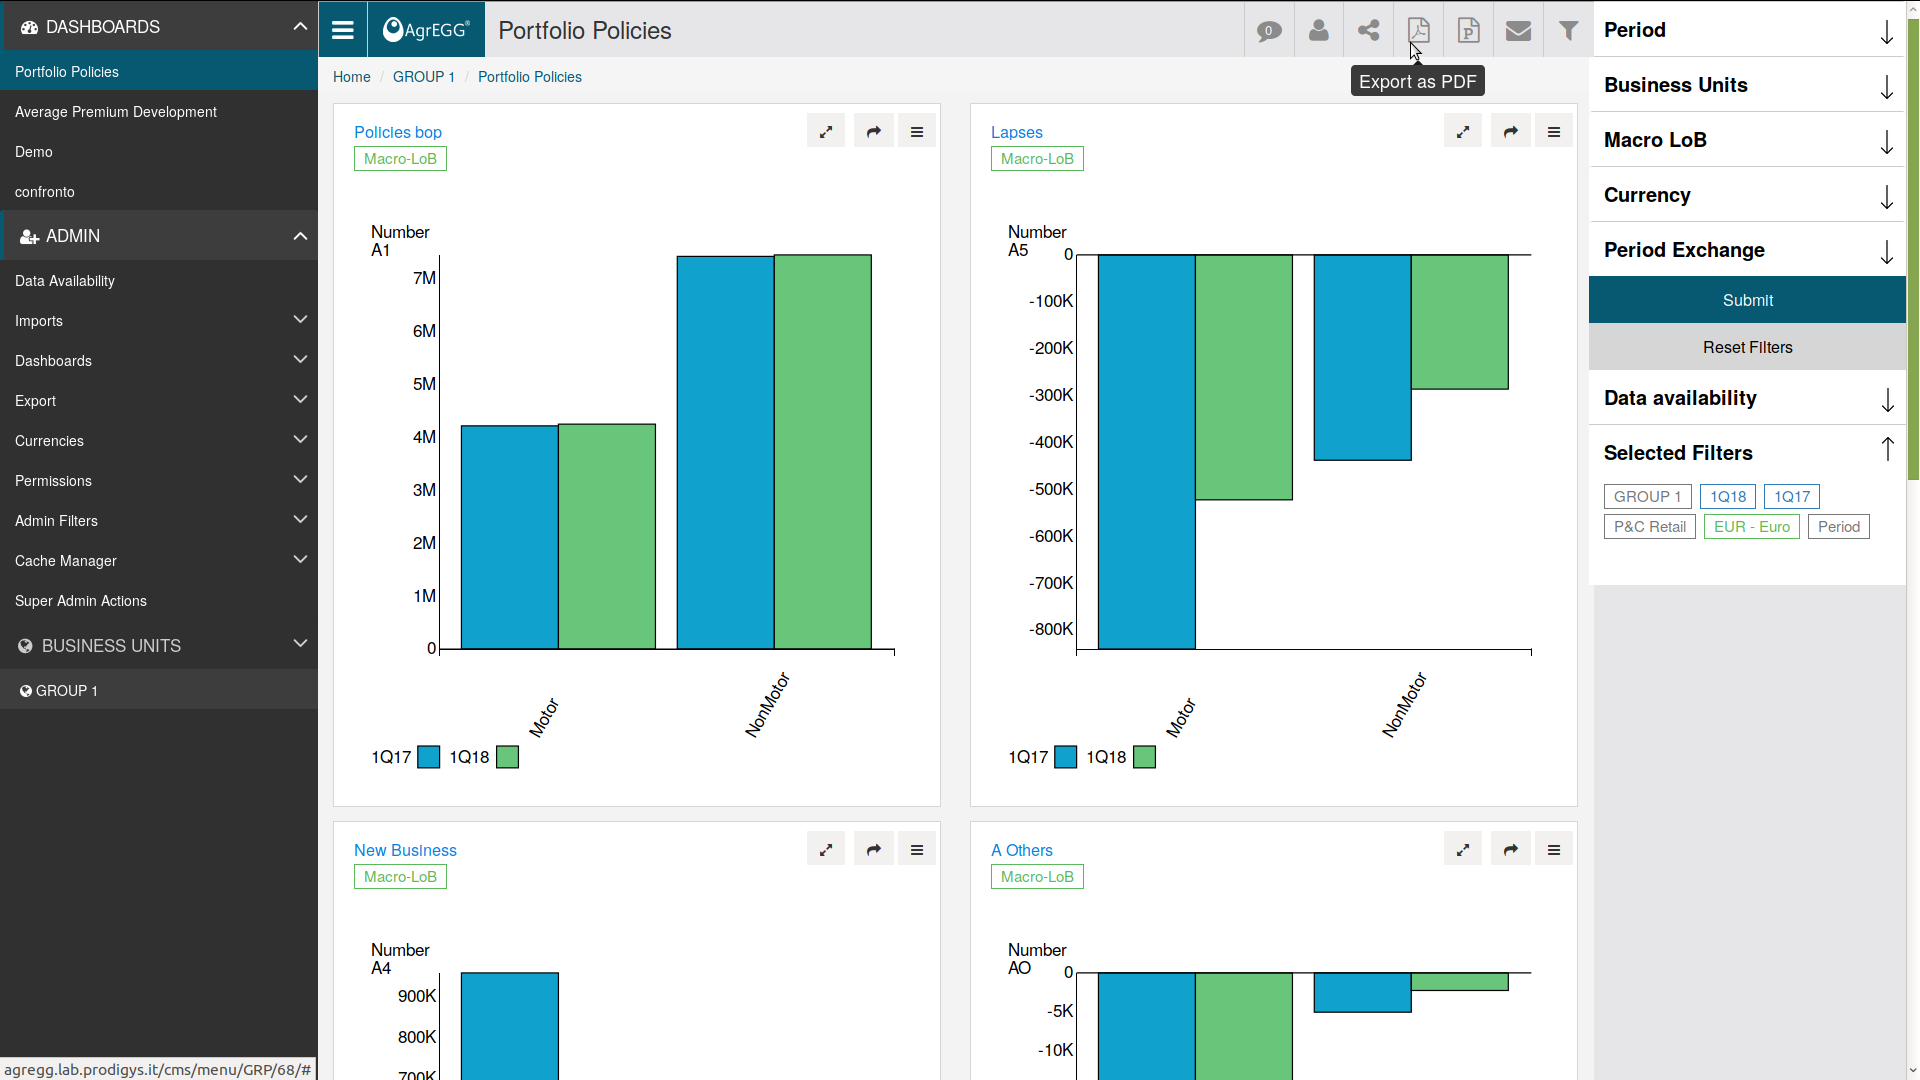
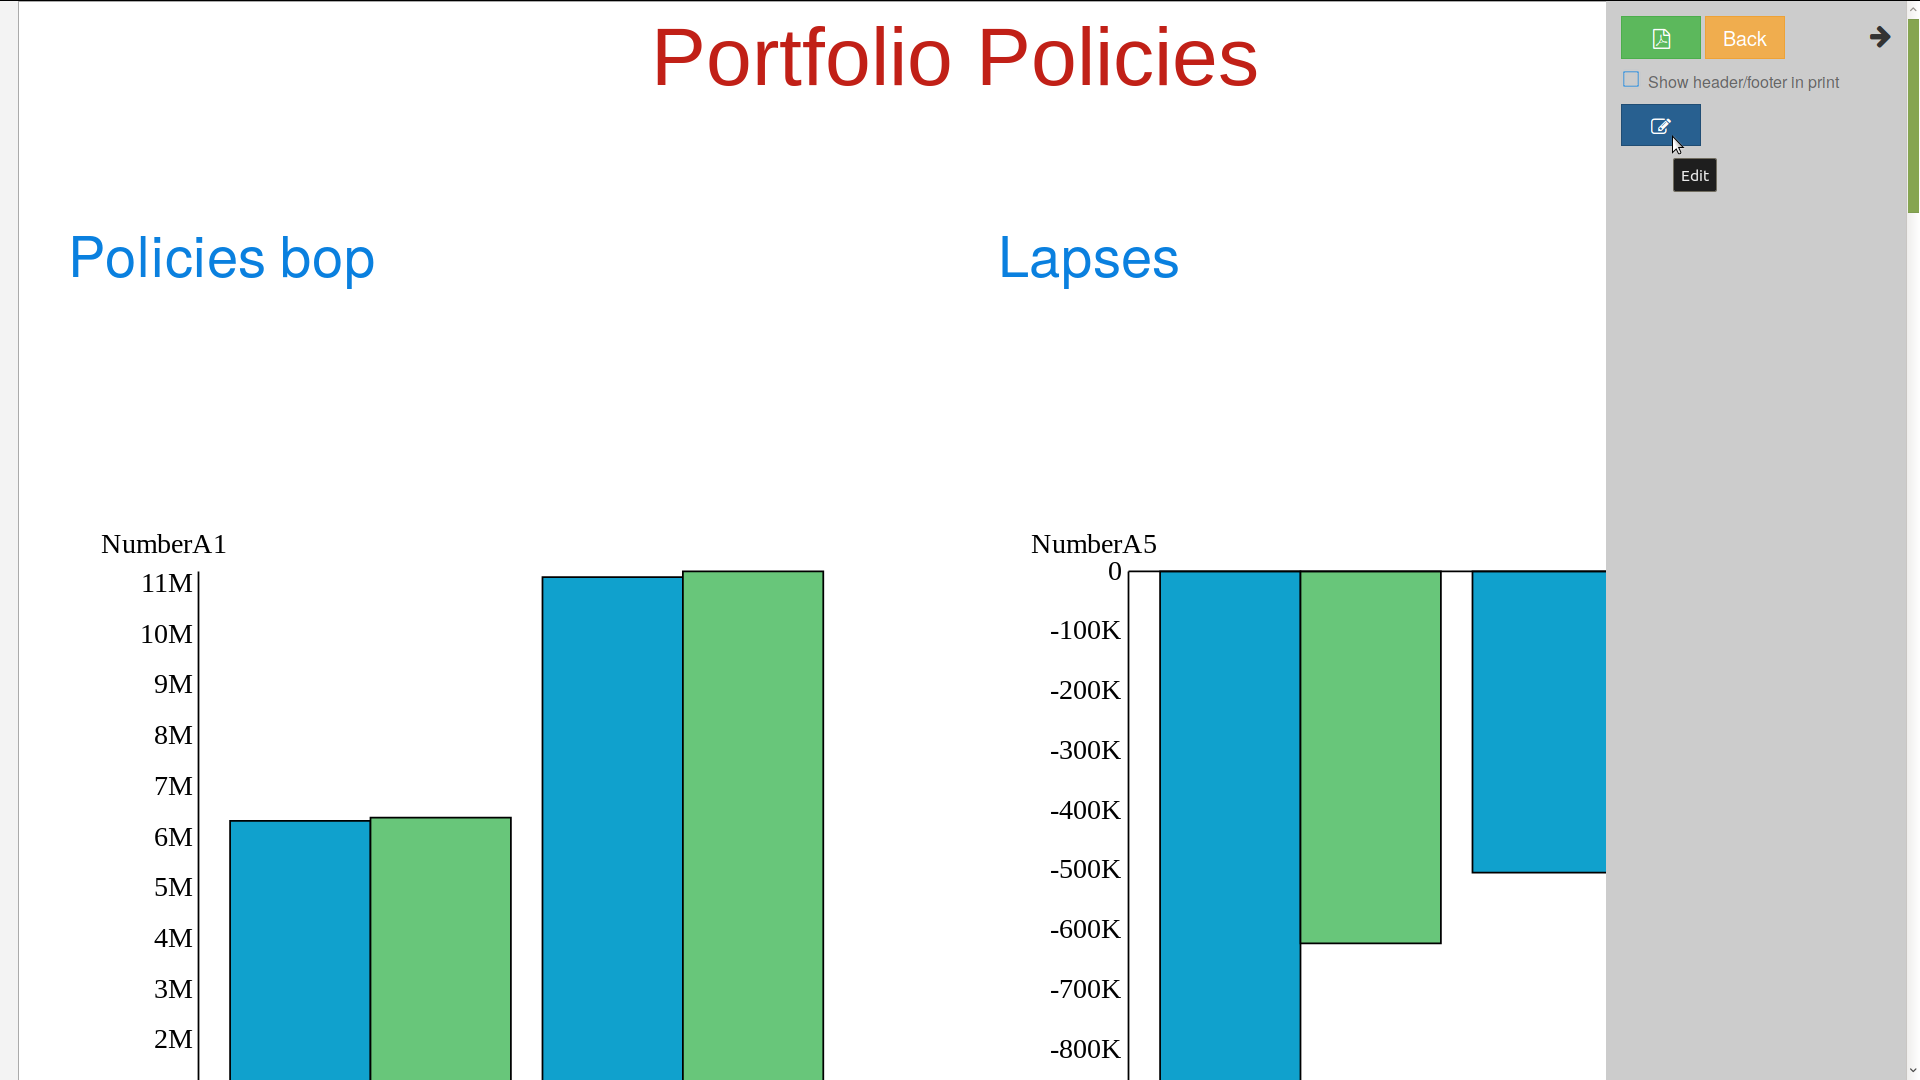
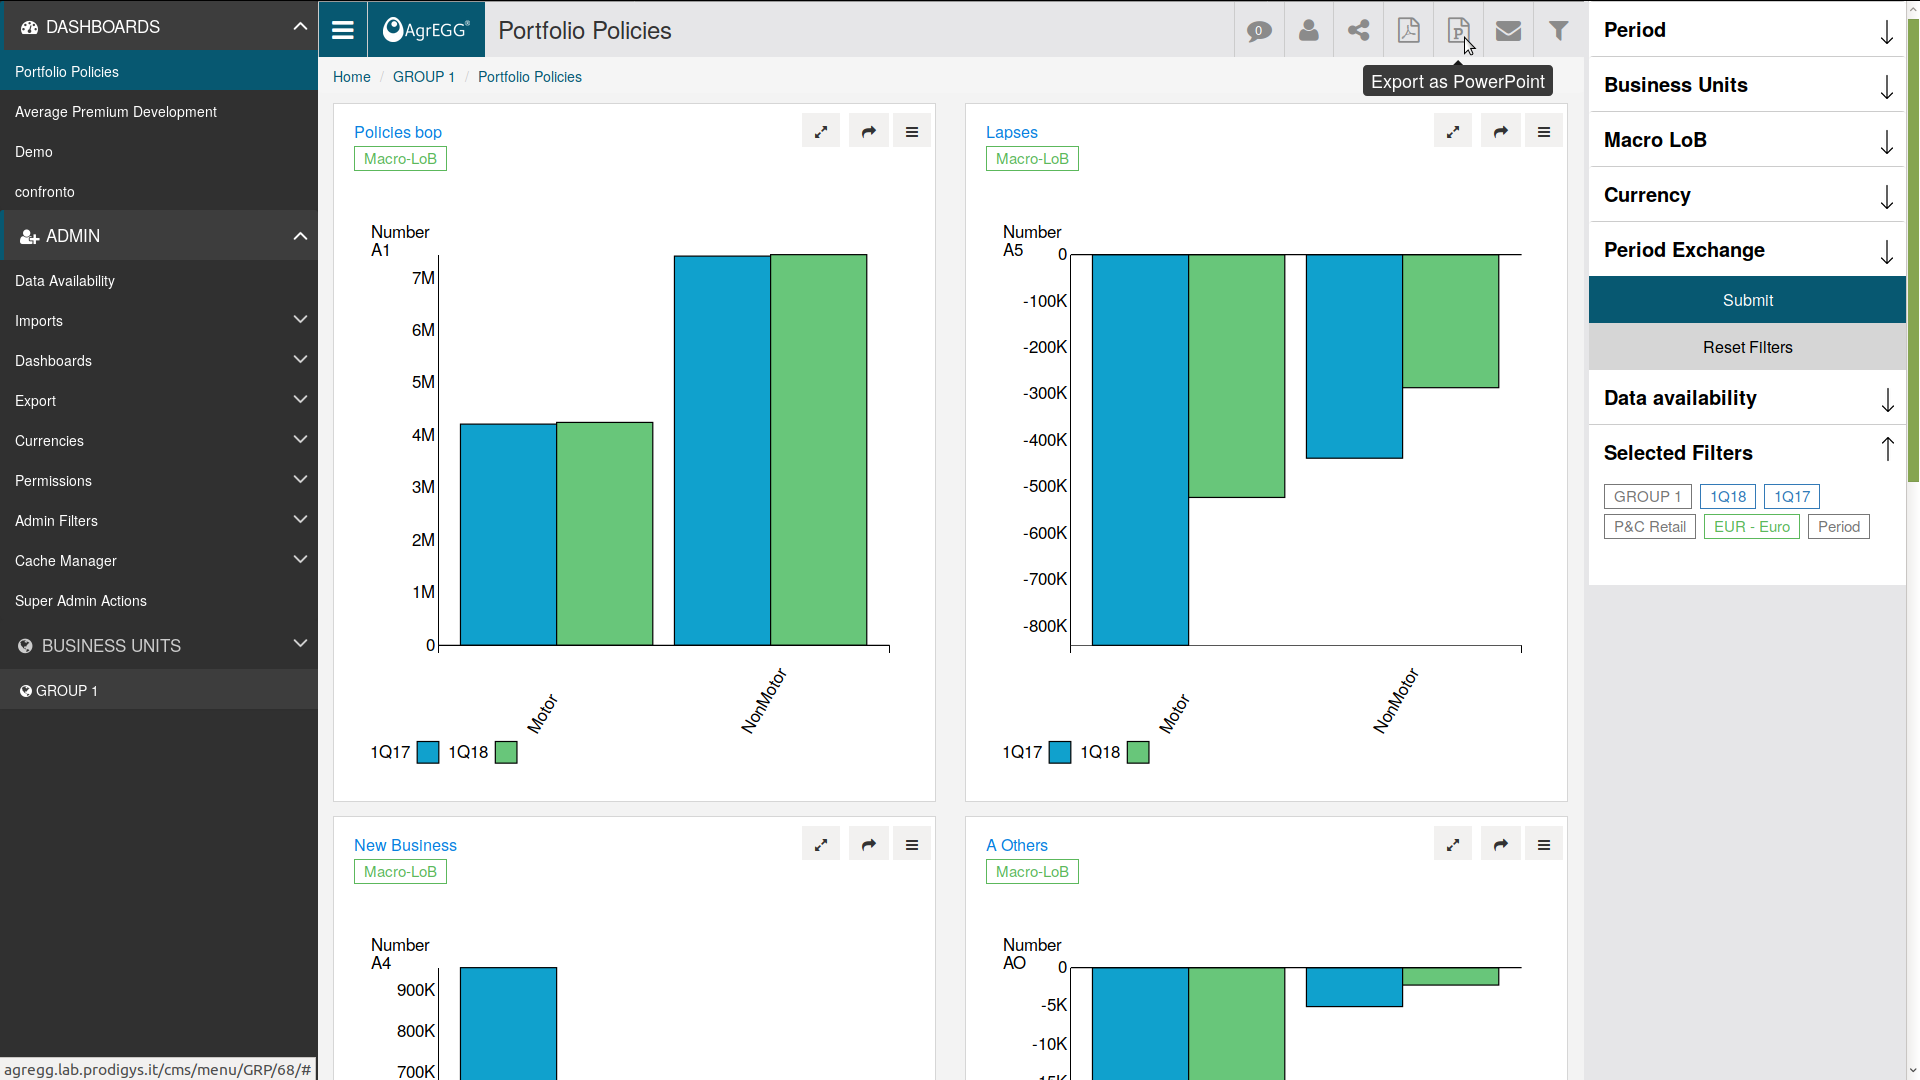
A whole Dashboard can be downloaded as a PDF file. Click the button “Export as PDF” on the top bar.
A preview will be shown. If necessary it is possible to edit it, otherwise click “Export PDF” to download the file.
Power Point Export
Similarly, a whole Dashboard can be downloaded as a Power Point file. Click the button “Export as Power Point” on the top bar.
You can upload a custom template for each By Whom or global via the django admin interface in the “PPTXs Config For Dashboard” table.
The power point could have #title# where do you want the dashboard title. The power point could have #fw# where do you want the current subsite by whom name. The power point could have #period# where do you want the last period selected label if a filter is manually selected. The power point could have #period#-1 where do you want the last period selected label - N year if a filter is manually selected. And in a text palceholder the pptx share string (e.g. !#/cms/menu/1/41/!#106!# ). You can obtain this string by pressing CTRL + Q or via the share menu.
If the graph is a table you can obtain a single value via the following snippet, where C0 is the first column and R0 is the first row.
!#/cms/menu/1/41/!#106!#R0C0
You can also, only for columns, get last column value by using -1 insted of 0 (e.g. !#/cms/menu/1/41/!#106!#R0C-1), or -2 and so on
If the code end with color (e.g. !#/cms/menu/1/41/!#106!#R0C0!#color) a semaphore will be show.
You can select if the power point is global and add a json config to use the power point only in some specific dashboard based on filter (gff):
{"key": "level_item_x_attr_X", "value": "150"}
First of all AgrEGG is searching non global report for specific by whom and filters. If not report is found AgrEGG search for global report
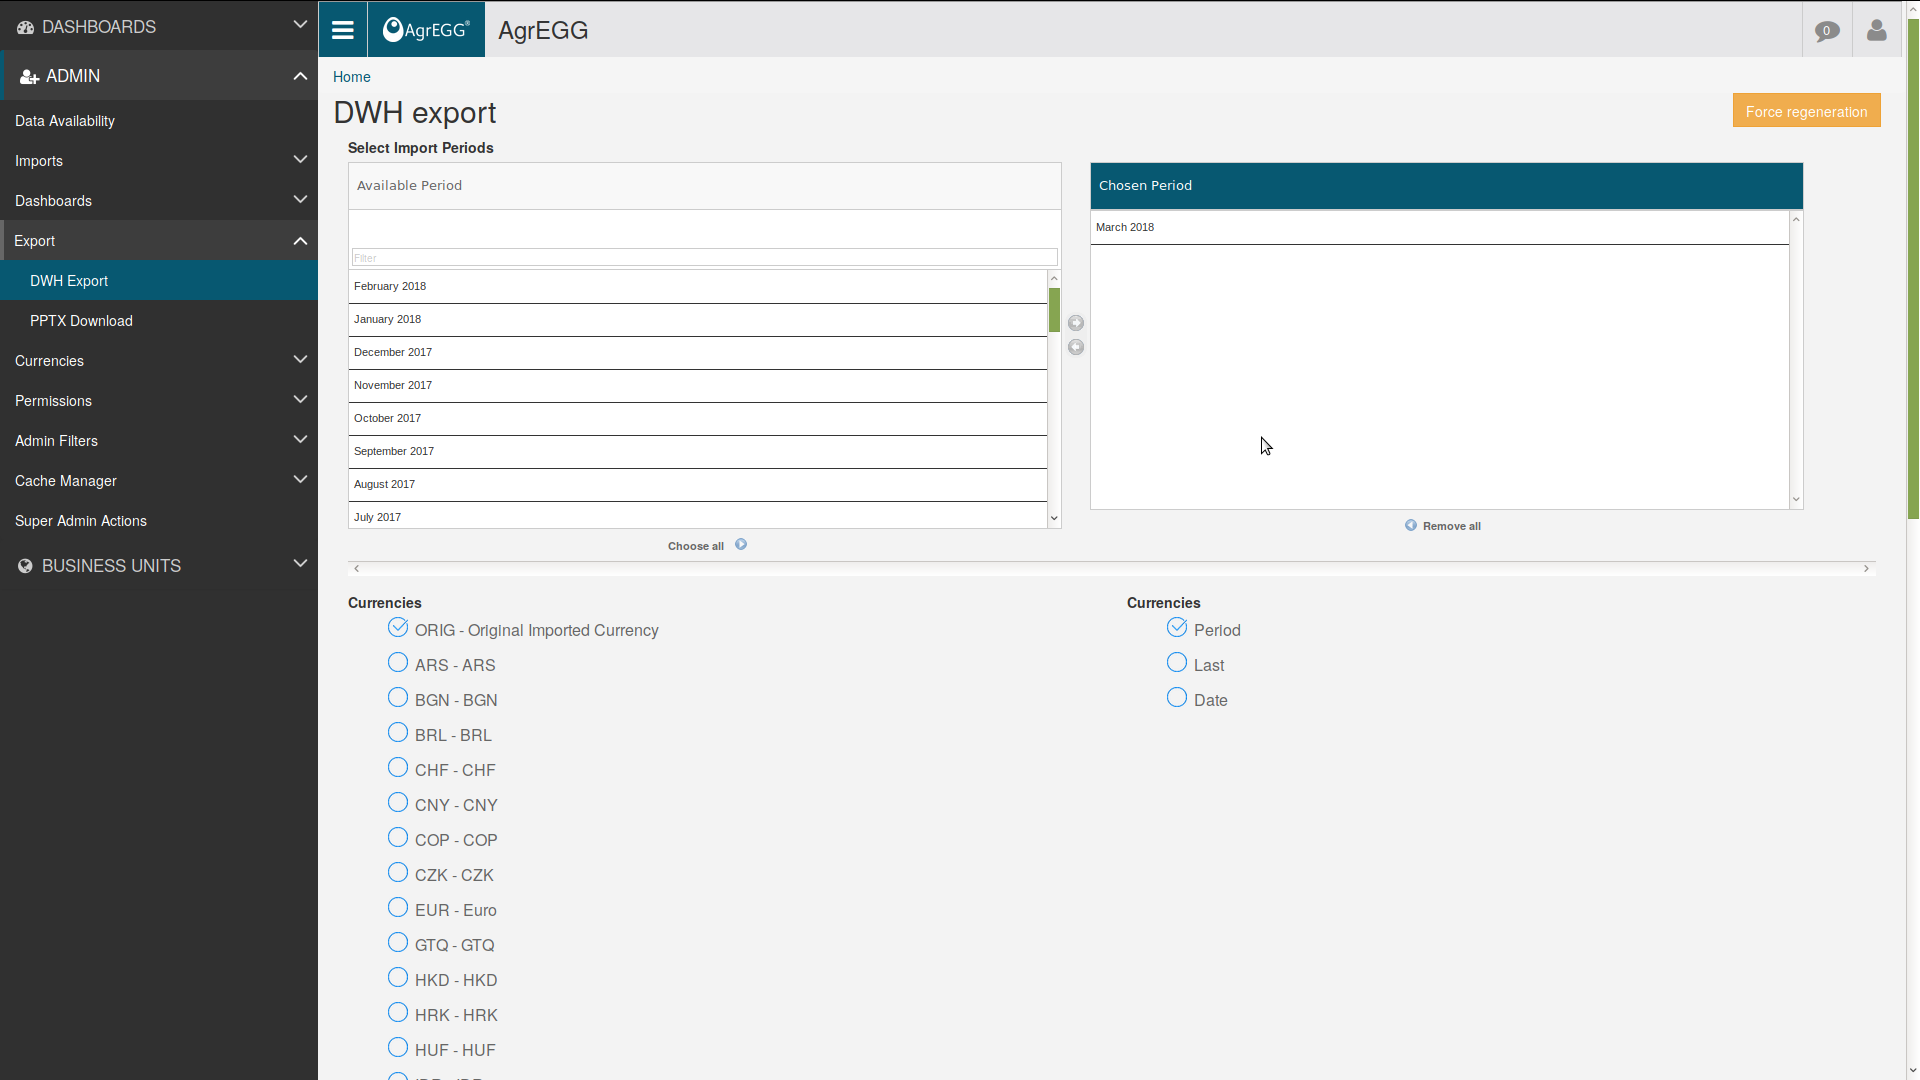
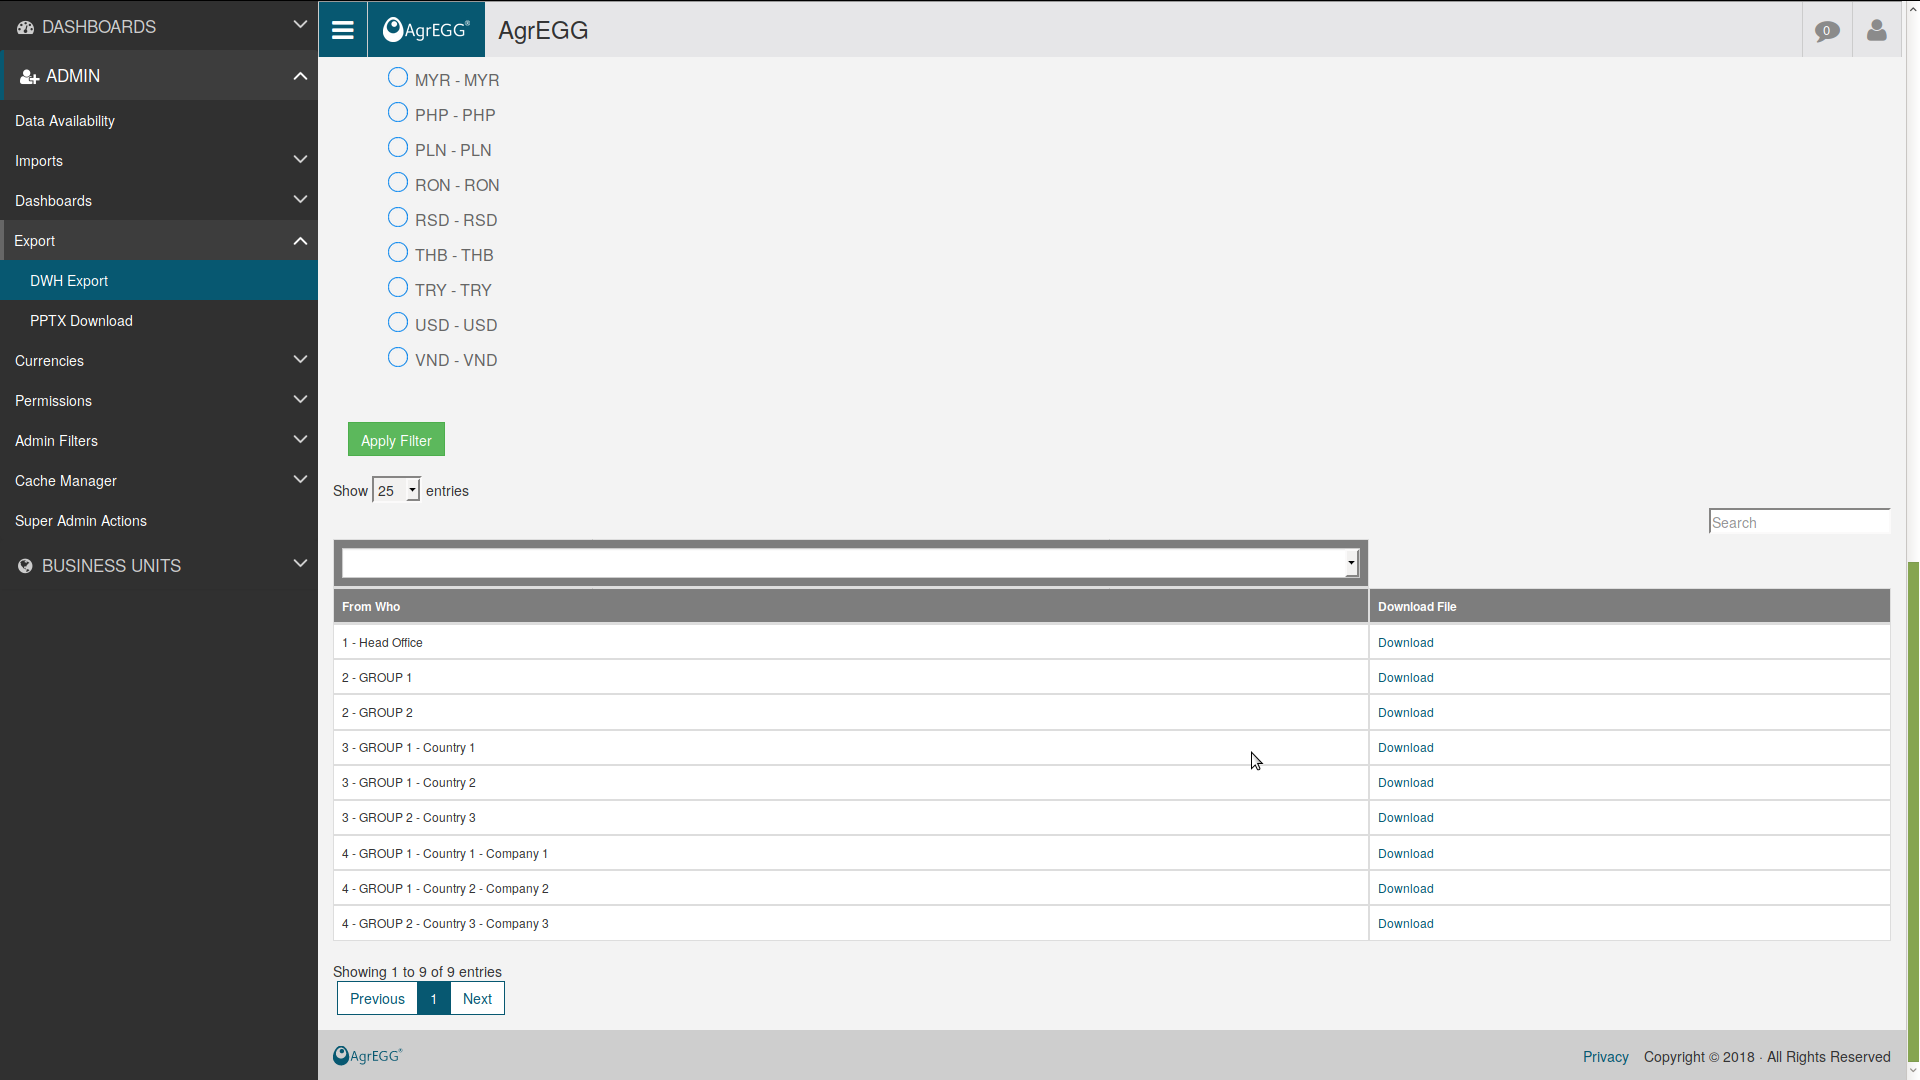
DWH Report
GO under ADMIN->Export->DWH Export. Select the desired period, optionally the currency, and it will be possible to download a csv file with the data, divided by business units, if available.
DWH Export API
A dedicated API exist that allow exporting DWH data. It is necessary to perform a GET request to the page generator/dwh_export_api/1, and optionally adding the following query string parameters:
kpi: KPI code(s)
from_who: id of the data view for which data have been imported
per: id of the period(s)
cur: the currency in which monetary values should be exported
For example: generator/dwh_export_api/?kpi=KPI1&from_who=1&per=2&per=3&cur=1 The resulting JSON will be a list of key-values, with the keys being:
id of the period
name of the period
id of the KPI
description of the KPI
code of the KPI
id of the data view
name of the data view
currency (if any)
value of the KPI
a field for each of the filters applied (if any)
It is necessary to be logged on the platform to perform such queries.
PPTX Report
It is also possible to automatically create customized Power Point presentations.
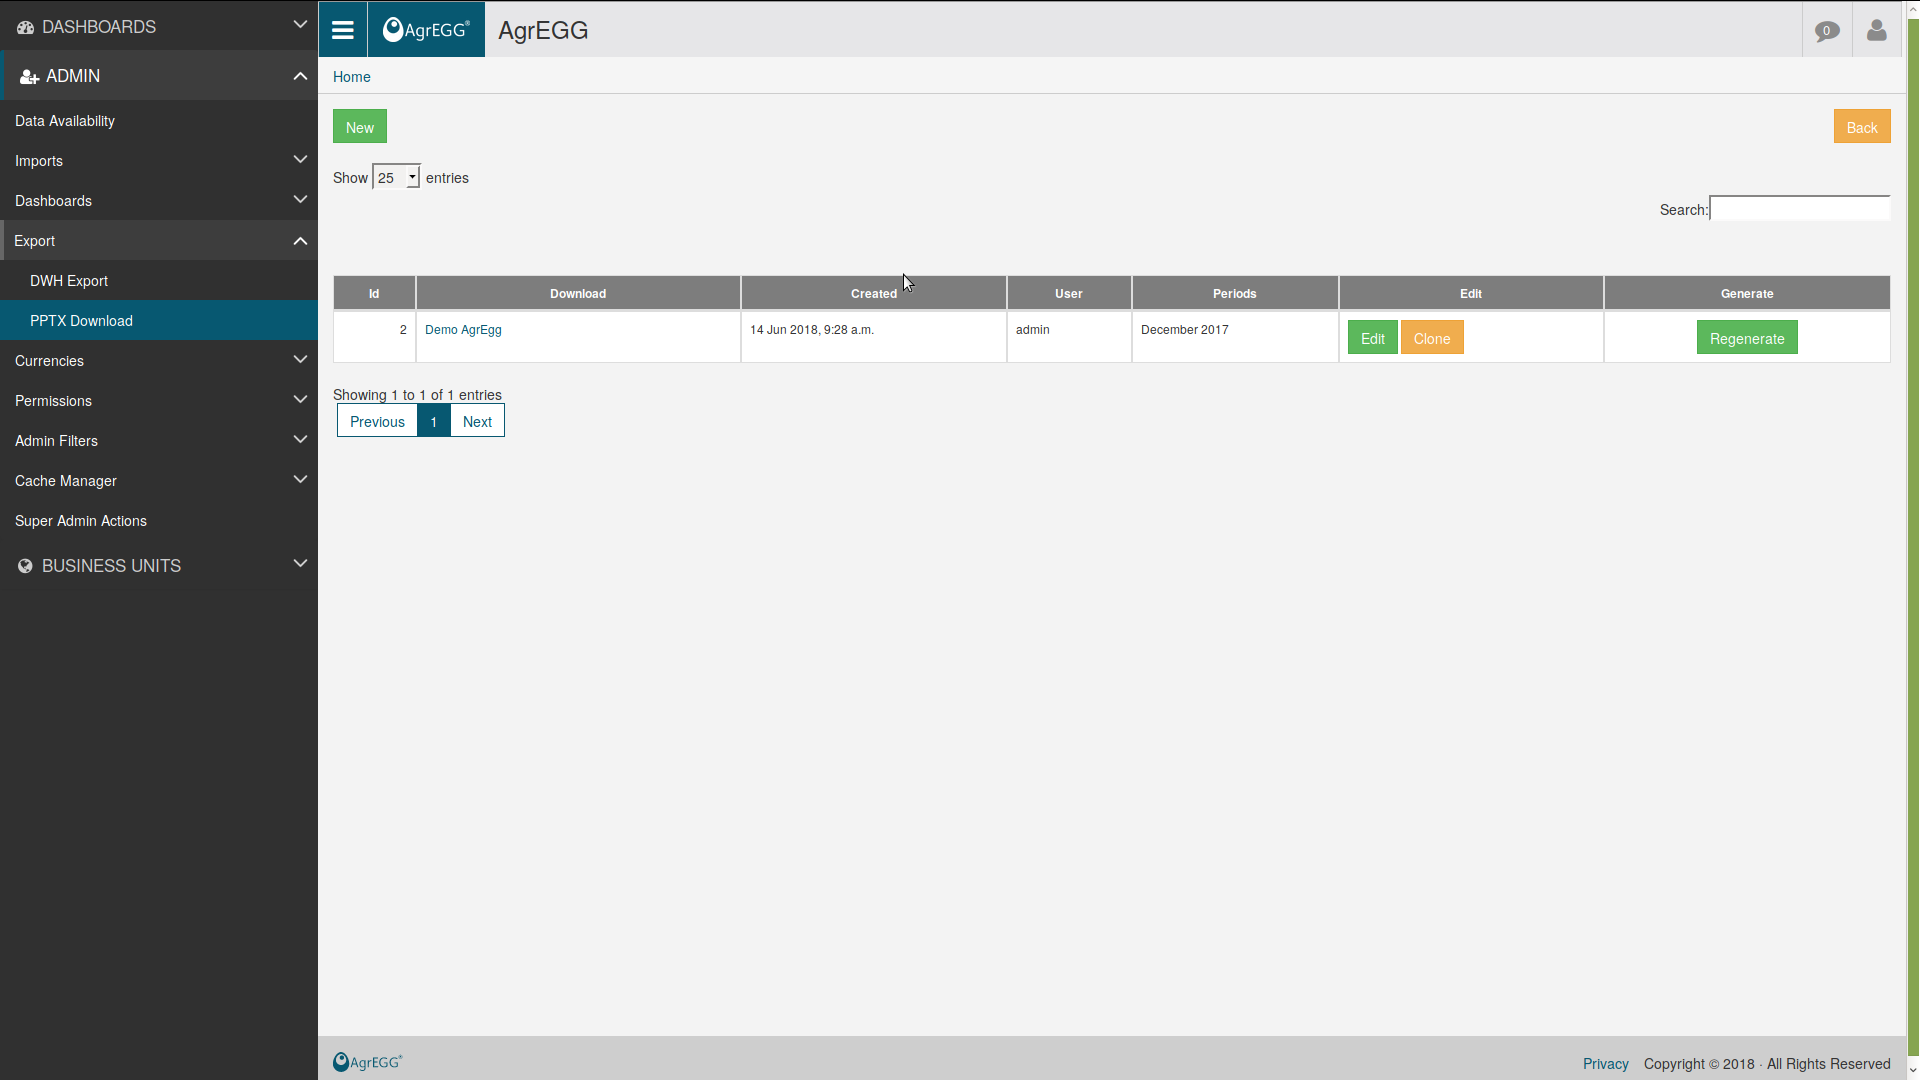
Go under ADMIN->Export->PPTX Download, then click “New”. Select the business unit under groups. It is necessary to provide a .pptx template file, to be uploaded via the “Browse” button. The power point can be empty or with placeholder item. The placeholder can be obtained via the share menu in each graph. If you want to get a cella value append the row and the column at the end of the snipped: “R3,C4!#” Remember that the coordinates are zero bases and the header count as row number 0.
Give a name to the report and click “Save”.
You will be redirected to the main page of the PPTX Reports.
Here you can Generate the power point with the placeholder with the “generate” button or you can create a bulked action with the “Bulk Generate” button. With the “Bulk generate” action you will be redirected to a page where you can select the by whom you would like to generate the power point or you can select a list of dashboard that will be fully used for power point generation. otherwise if you not select any Dashboard the placeholder will be replaced for each By Whom selected.
Please note that the placeholder string should not have “fwf” strings (that stand for By Whom) and “per” strings (that stand for Period)
Please remember that only user with PPTX Export permissions or staff user can edit all other Power Point templates.
Placeholder configuration
If you want to show the last upload date of an import type id
"upload_date": <import_type_id>

!#/cms/menu/6/69/!#upload_date=%m=None!#
!#/cms/menu/6/69/!#upload_date=%Y=None!#
!#/cms/menu/6/69/!#upload_date=%Y%m=None!#
!#/cms/menu/6/69/!#upload_date=%Y%m%d=None!#
If you want to show the By Whom label
"fw": !#/cms/menu/1/69/!#fw!#
If you want to show the cell value, for example row 3, cell 4 (0 based)
"fw": !#/cms/menu/1/69/!#188!#R3,C4!#