KPIs Analitycs
Under the sub-menu ADMIN->Admin Filters->KPI Analytics it is possible to access the screen for the creation and the configuration of rules for the visual analysis of the tabular reports and query reports contained in the Dashboard.
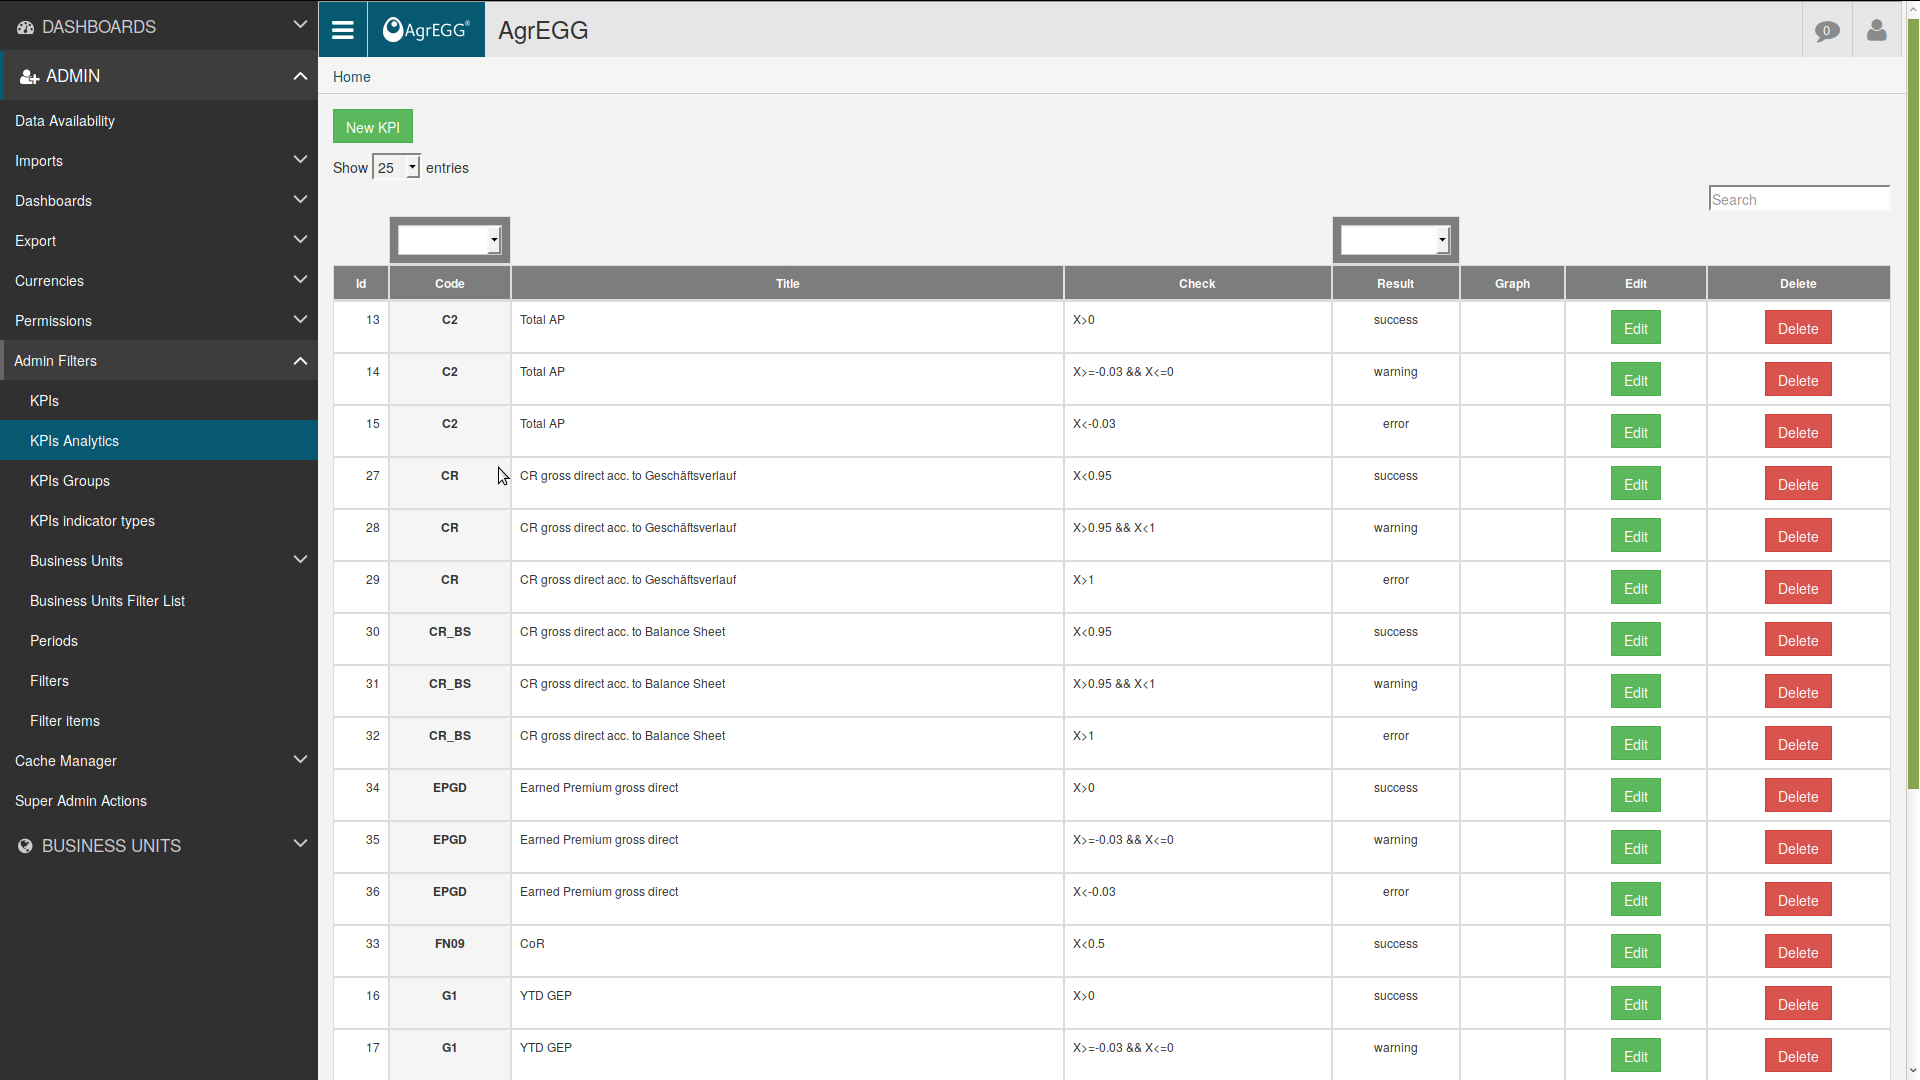
To create a new rule associated to a KPI click “New KPI” and insert the desired parameters in the configuration screen, or click “Edit” to modify an existing one.
New KPI:
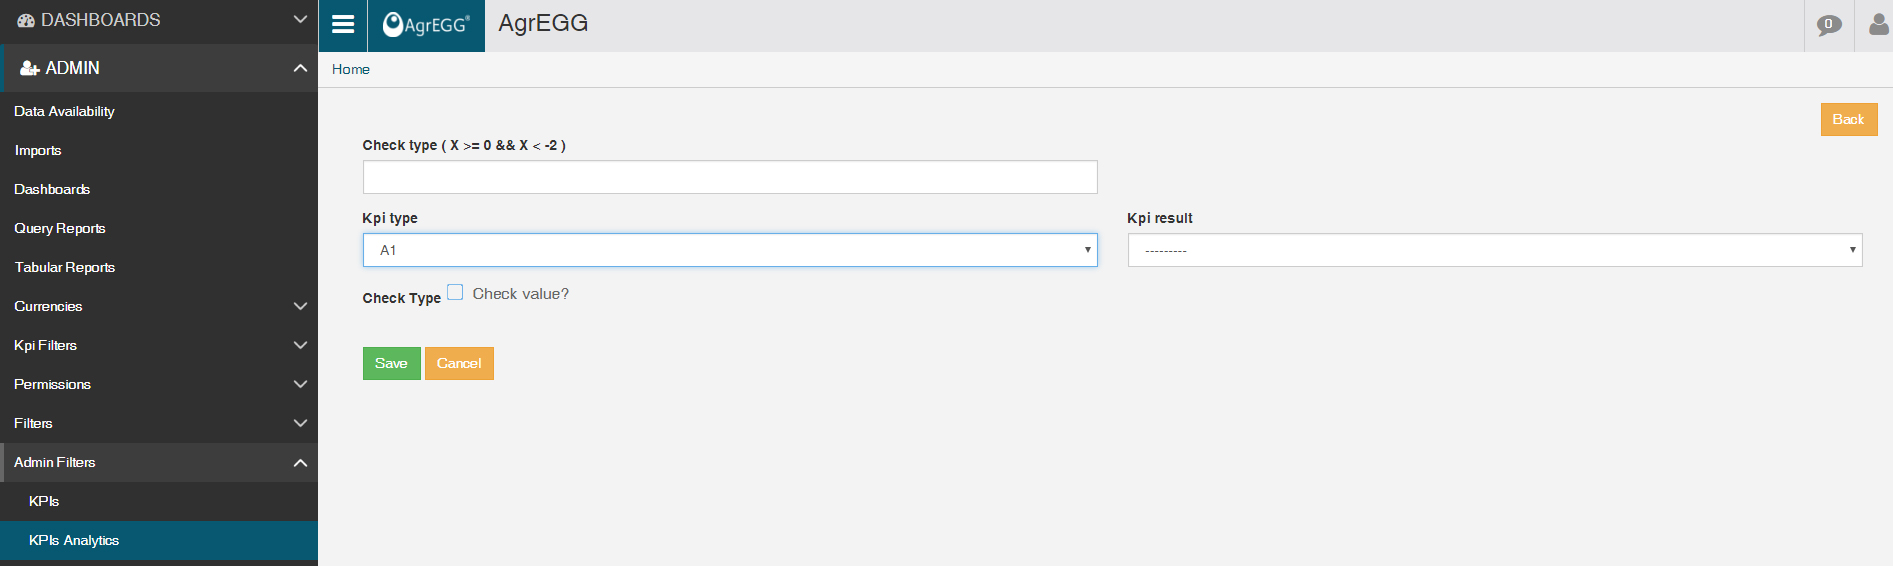
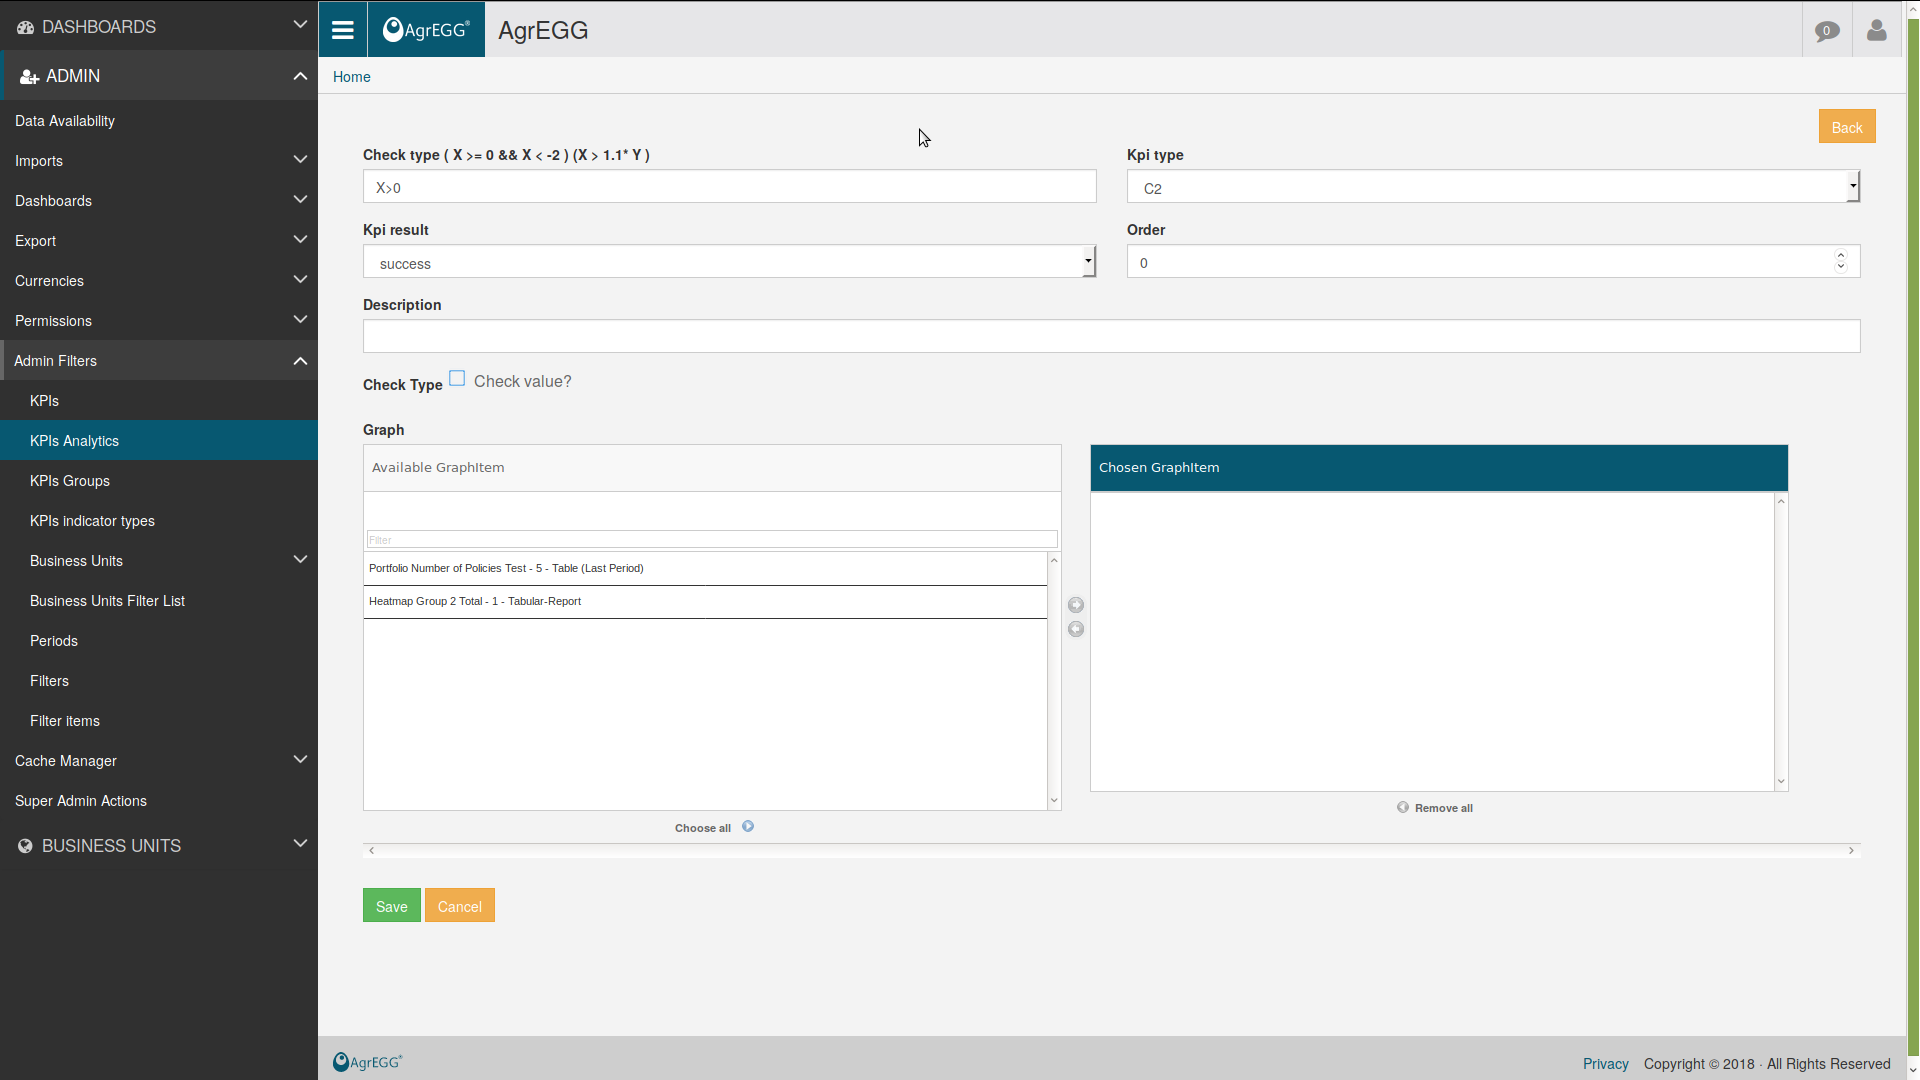
Kpi type: under the drop down menu it is possible to access the list where to select the KPI to which the selected rule should be added.
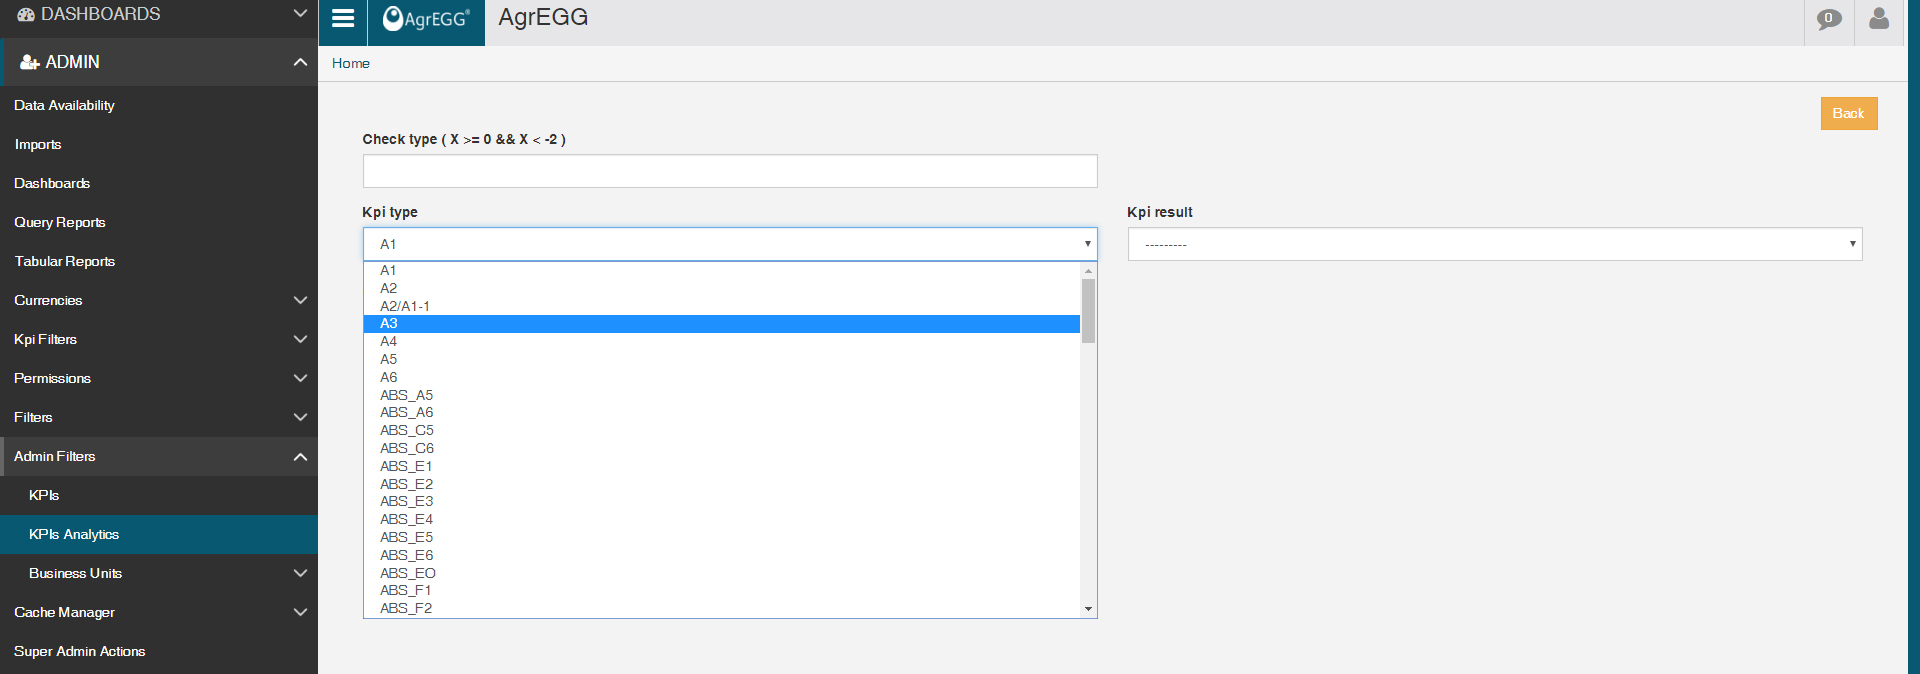
Check type: in this field insert the formula to check the desired rule.
Use: X = value, X < value, X > value, X >= value, X<= value.
To insert a value range use && between two functions.
For example: X>=0 && X<-2
delta(X) < KPI_CODE If the current row element delta is lower than another KPI_CODE (same filter and same period) delta(X) < delta(KPI_CODE) If the current row element delta is lower than the delta of another KPI_CODE (same filter and same period)
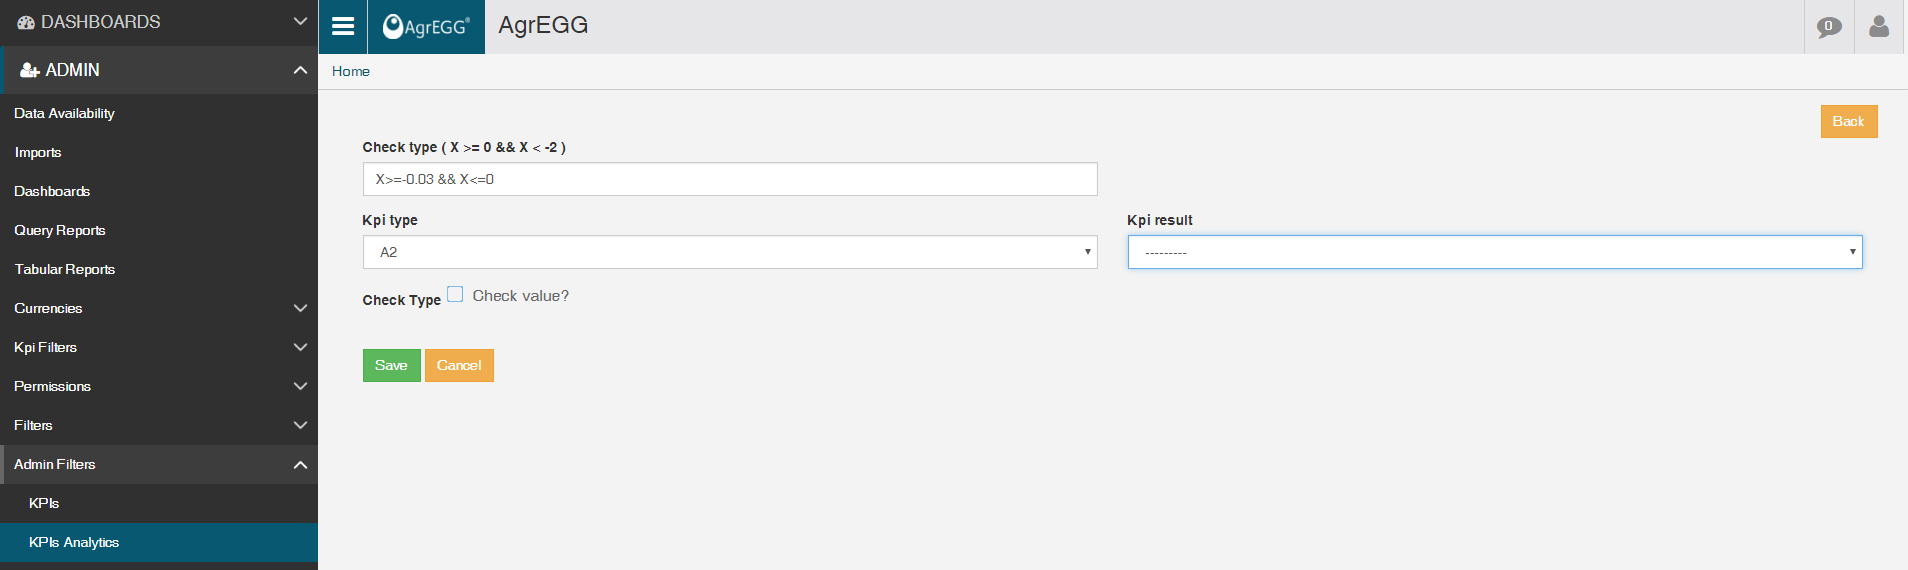
Check Type: Check value allows the control over cells containing KPI expressed in percent (%).
Check value? checked = active
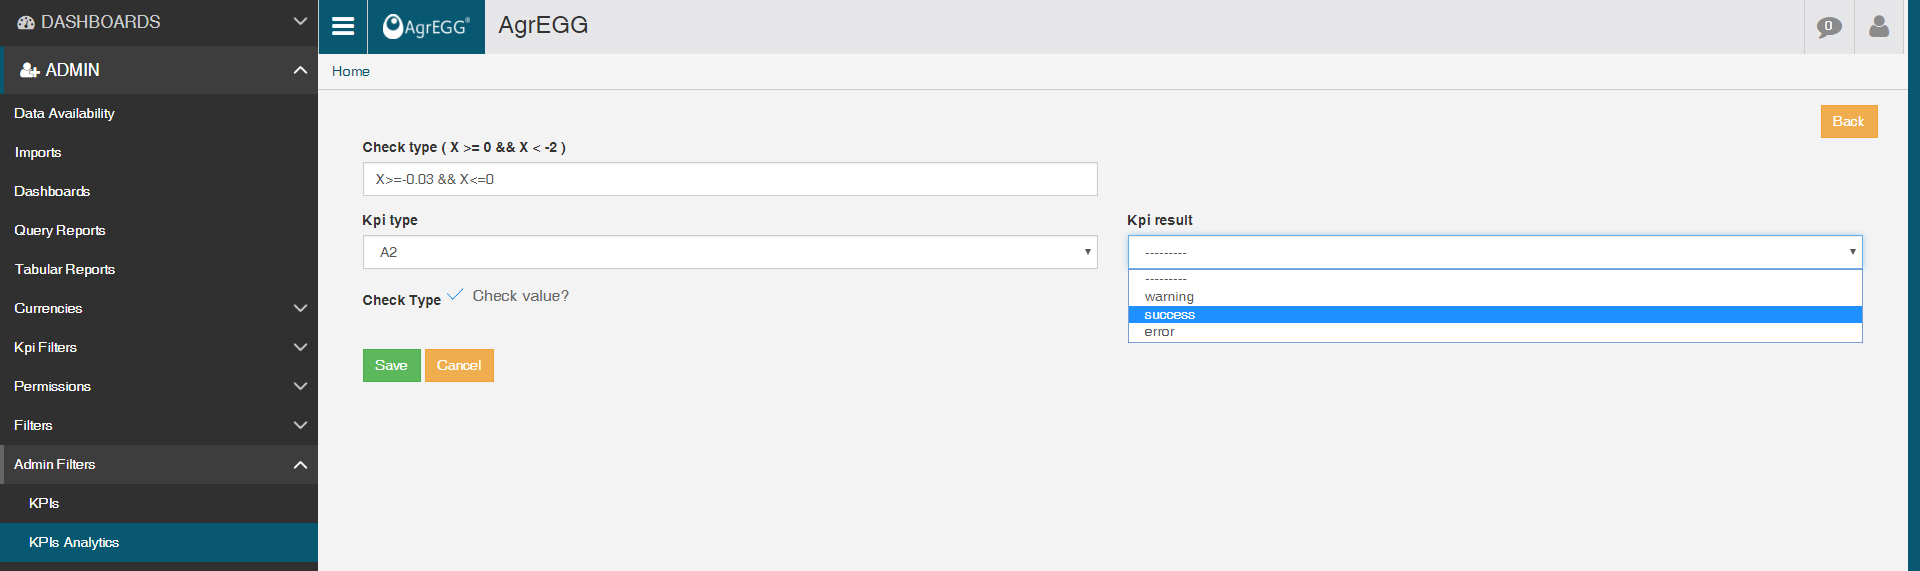
Kpi result: set the message one desires to get:
warning: highlight in yellow cells in the tabular report.
success: highlight in green cells in the tabular report.
error: highlight in red cells in the tabular report.