Pivot
In AgrEGG you can create a Pivot Table, like excels ones.
From the dashboard generator select the Pivot Table, add the kpis and the graph title
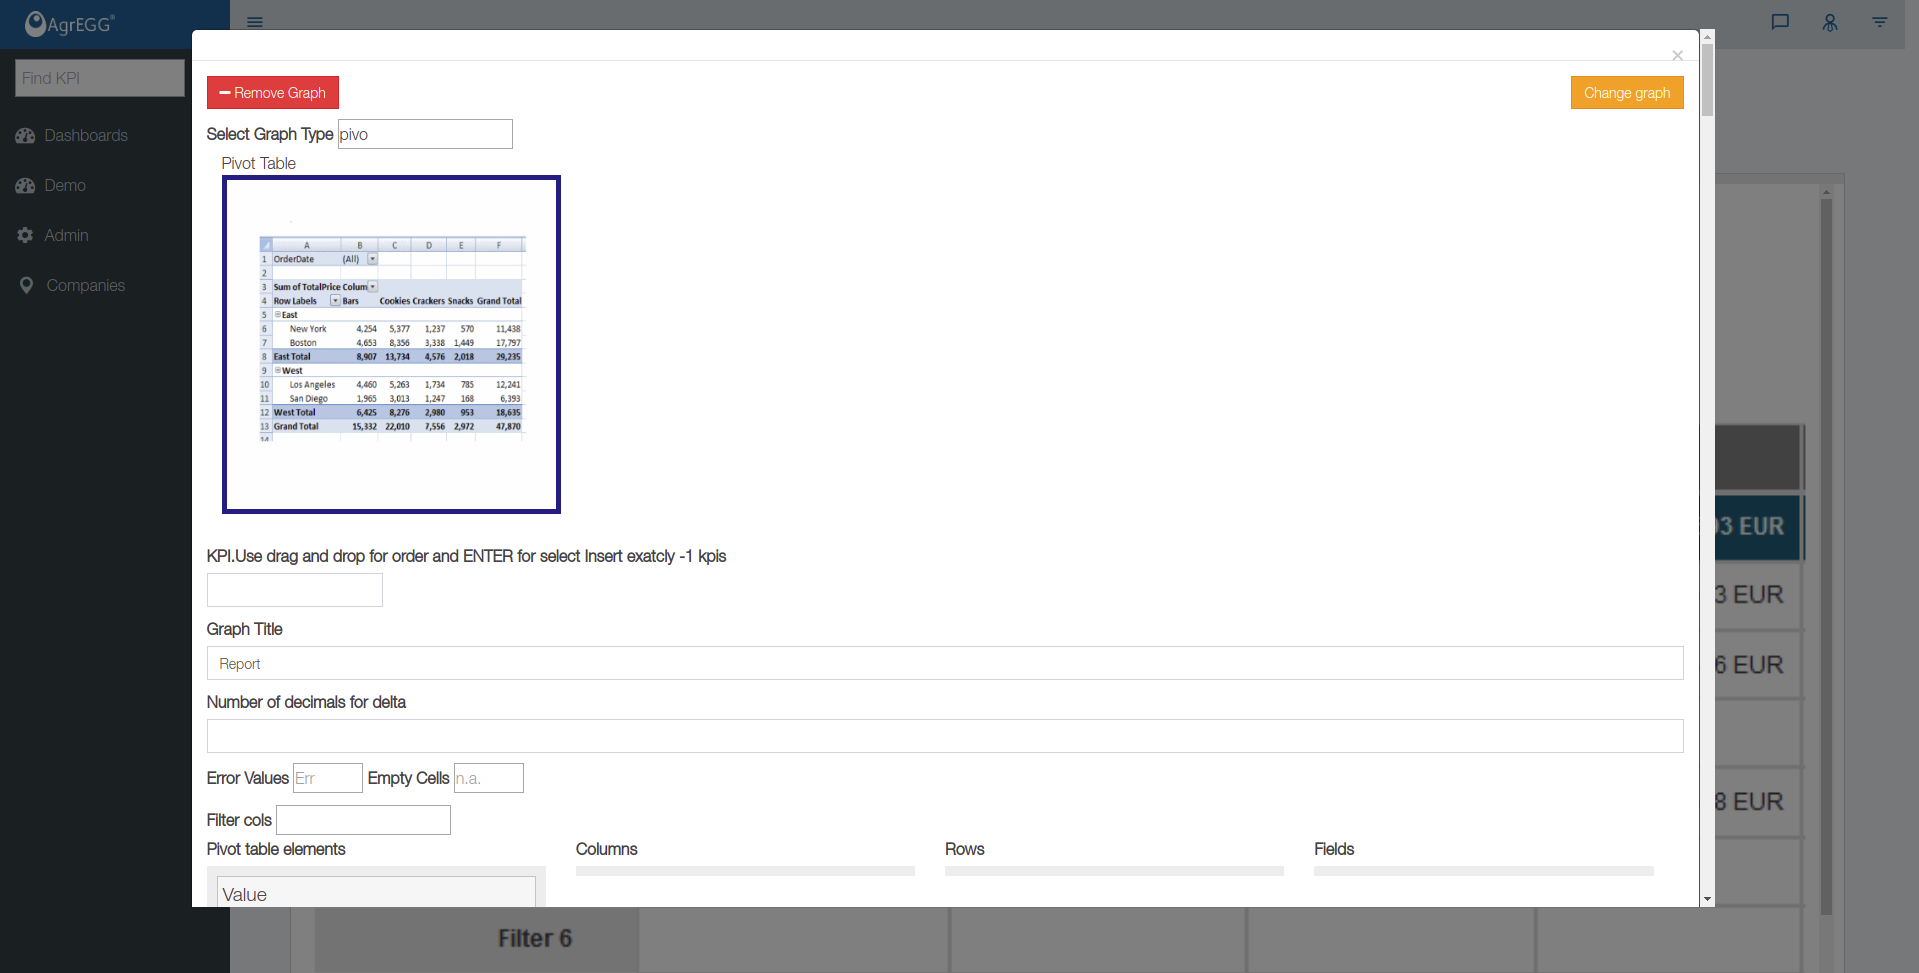
then start moving the corresponding columns to the pivot. Move the “Value” field under “Fields” column Move the “Period” field and the “Kpi Title” under “Columns” column Move the custom dimensions field and the “Kpi Title” under “Rows” column
Scroll down to “Show/hide extra option” and use the “Use Frontend PIVOT” if you want to allow the users to edit “dinamicaly” edit the frontend pivot.

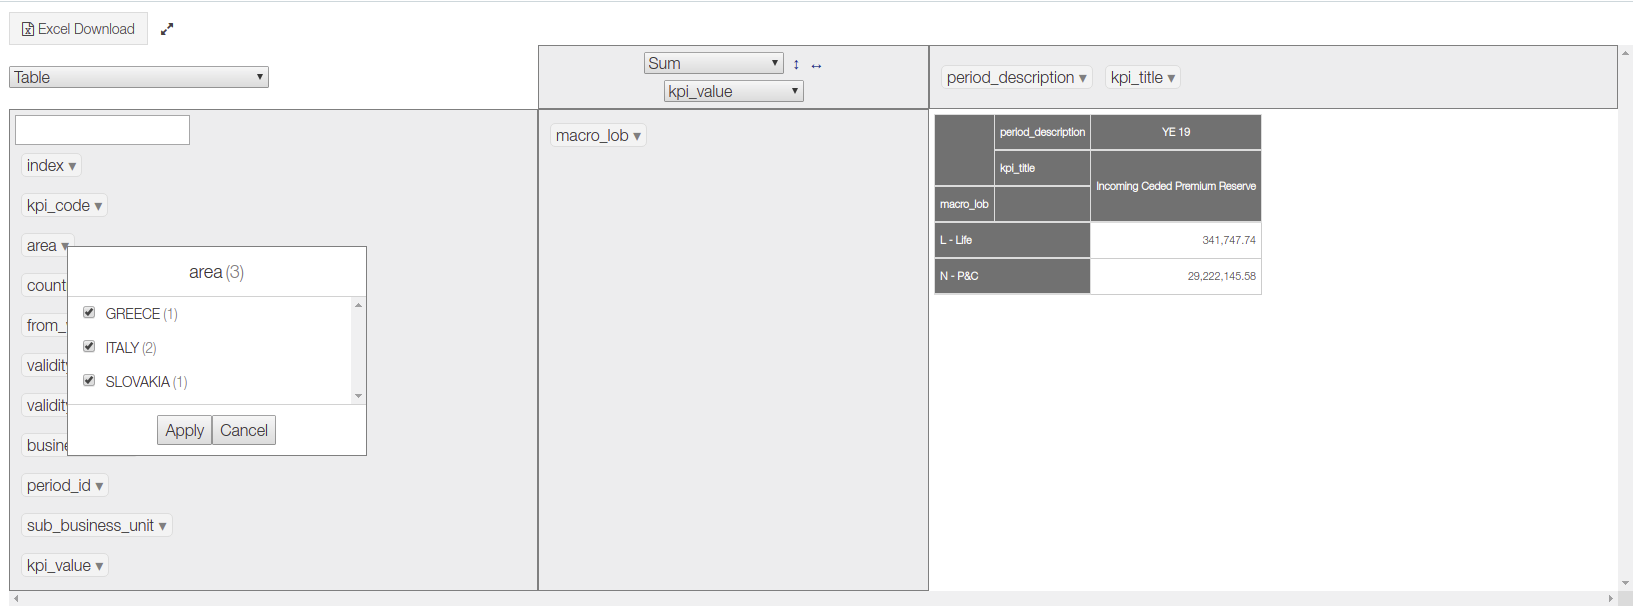
Your Pivot is now ready in frontend. You can use right menu filter or filter directly from the pivot fields
Show dimensions
If you want to see only the hierarchy without any values you have not to move the “Value” field under “Fields” column and you have not to select the KPIs.
Show calculated fields
In this case calculated formula cannot be used directly from KPIs Definition, but must be defined in the pivot config. Please remember to add also all based kpi in pivot table. In the extra config add the following configuration:
{"formulas": [
    "data['TR06'] = data['TR01'] * data['TR03']"
]}
Where TR01 and TR06 are the base kpis code. Kpi Code and period must existits under “Columns” definition, and “Value” must be exists under “Fields” definition.
If you want to show periods deltas (in percentage or not) the config should be like:
{ “show_delta”: “true”, “show_delta_percentage”: “true”}
You can combine all the options in this way:
{"formulas": [
    "data['TR06'] = data['TR01'] * data['TR03']"
],
"show_delta": "true", "show_delta_percentage": "true"}