KPIs
KPIs are the central numerical quantities which are analyzed in a dashboard.
Create a KPI
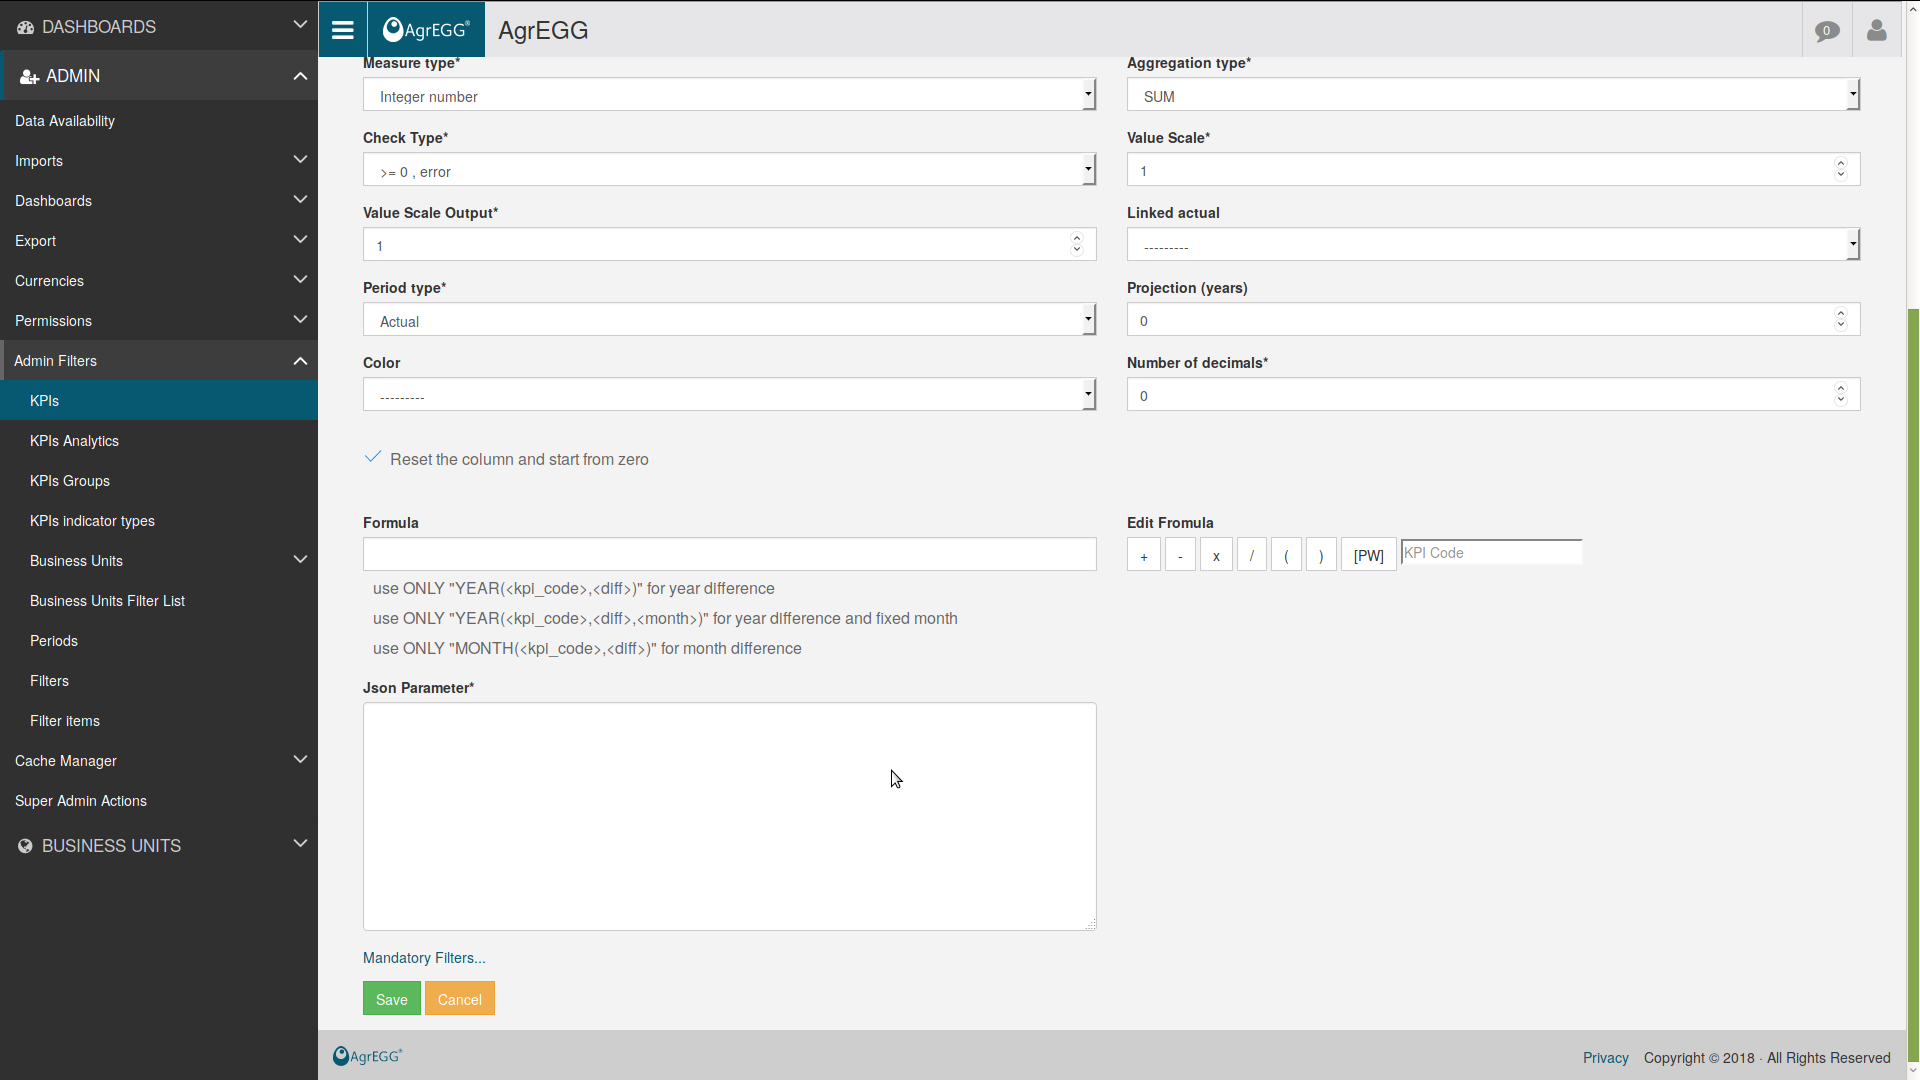
To create a new KPI, go under ADMIN->Admin Filters->KPIs.
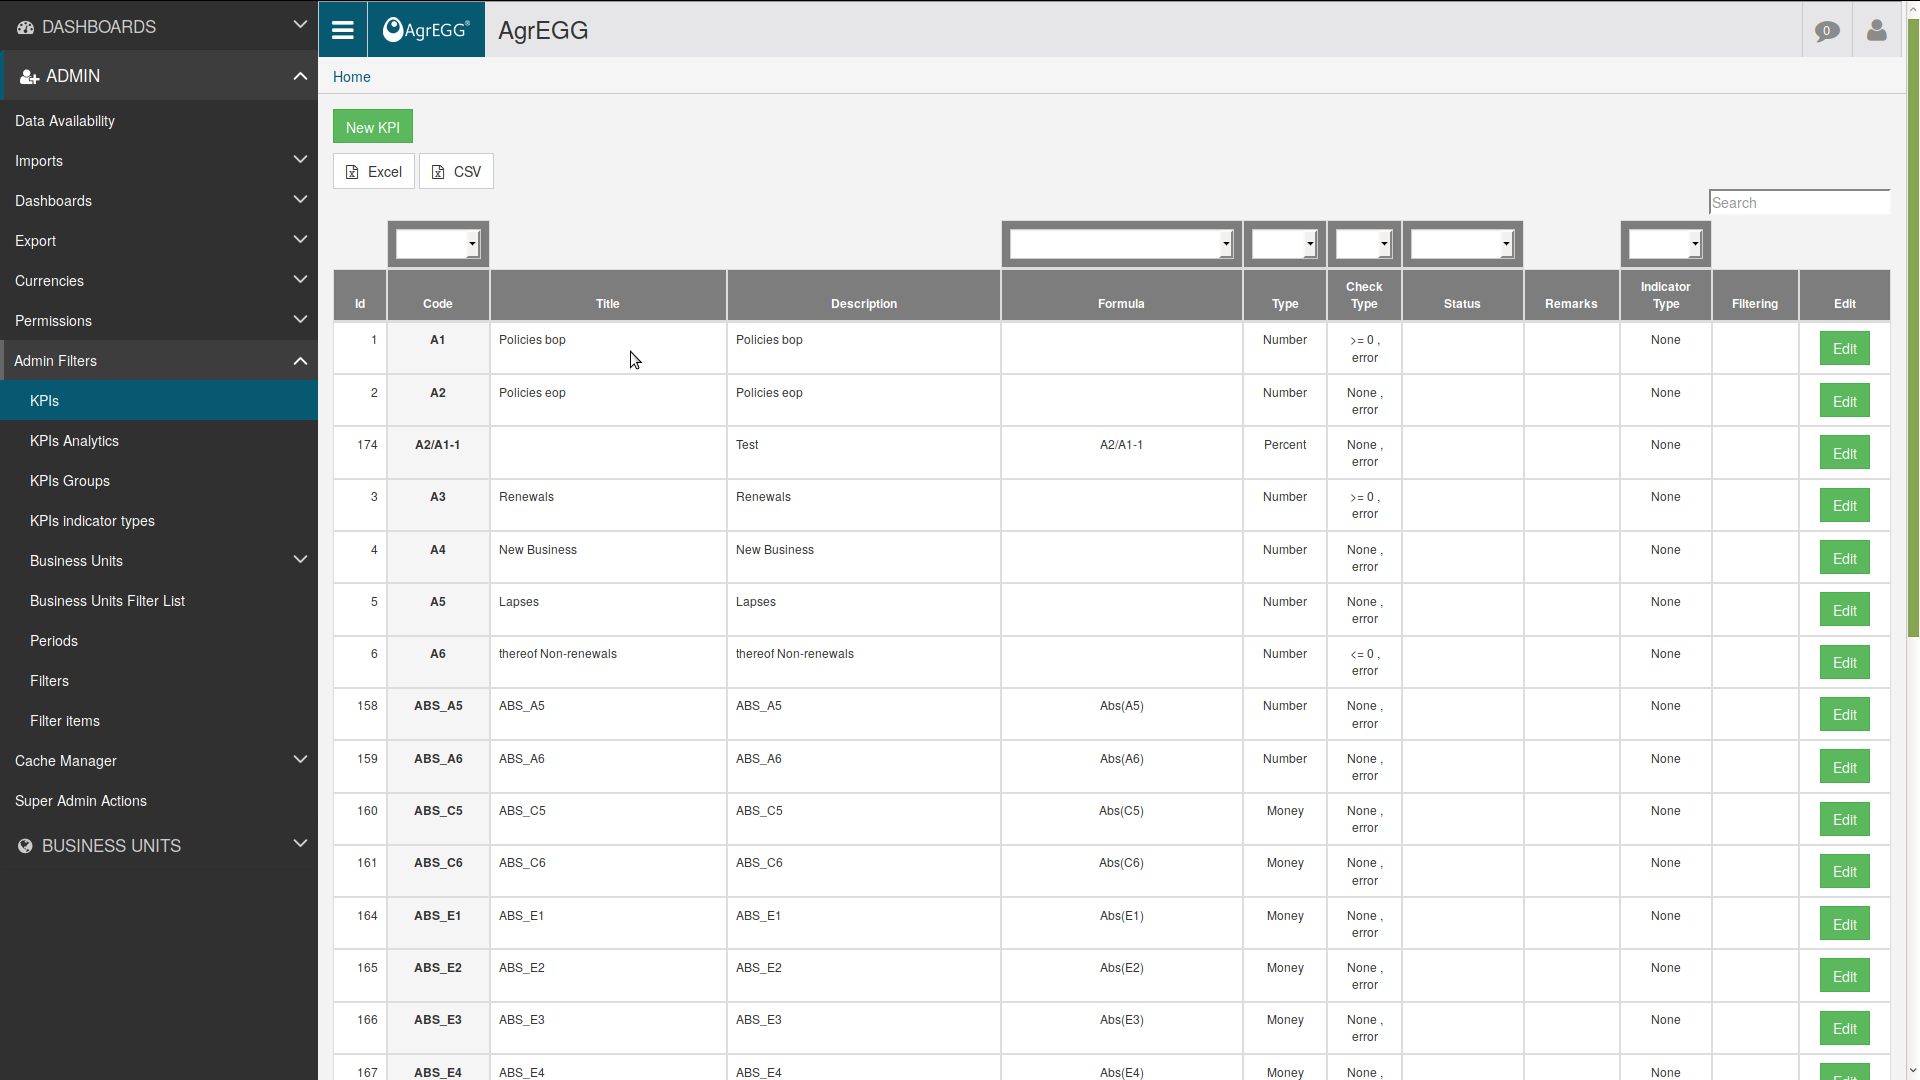
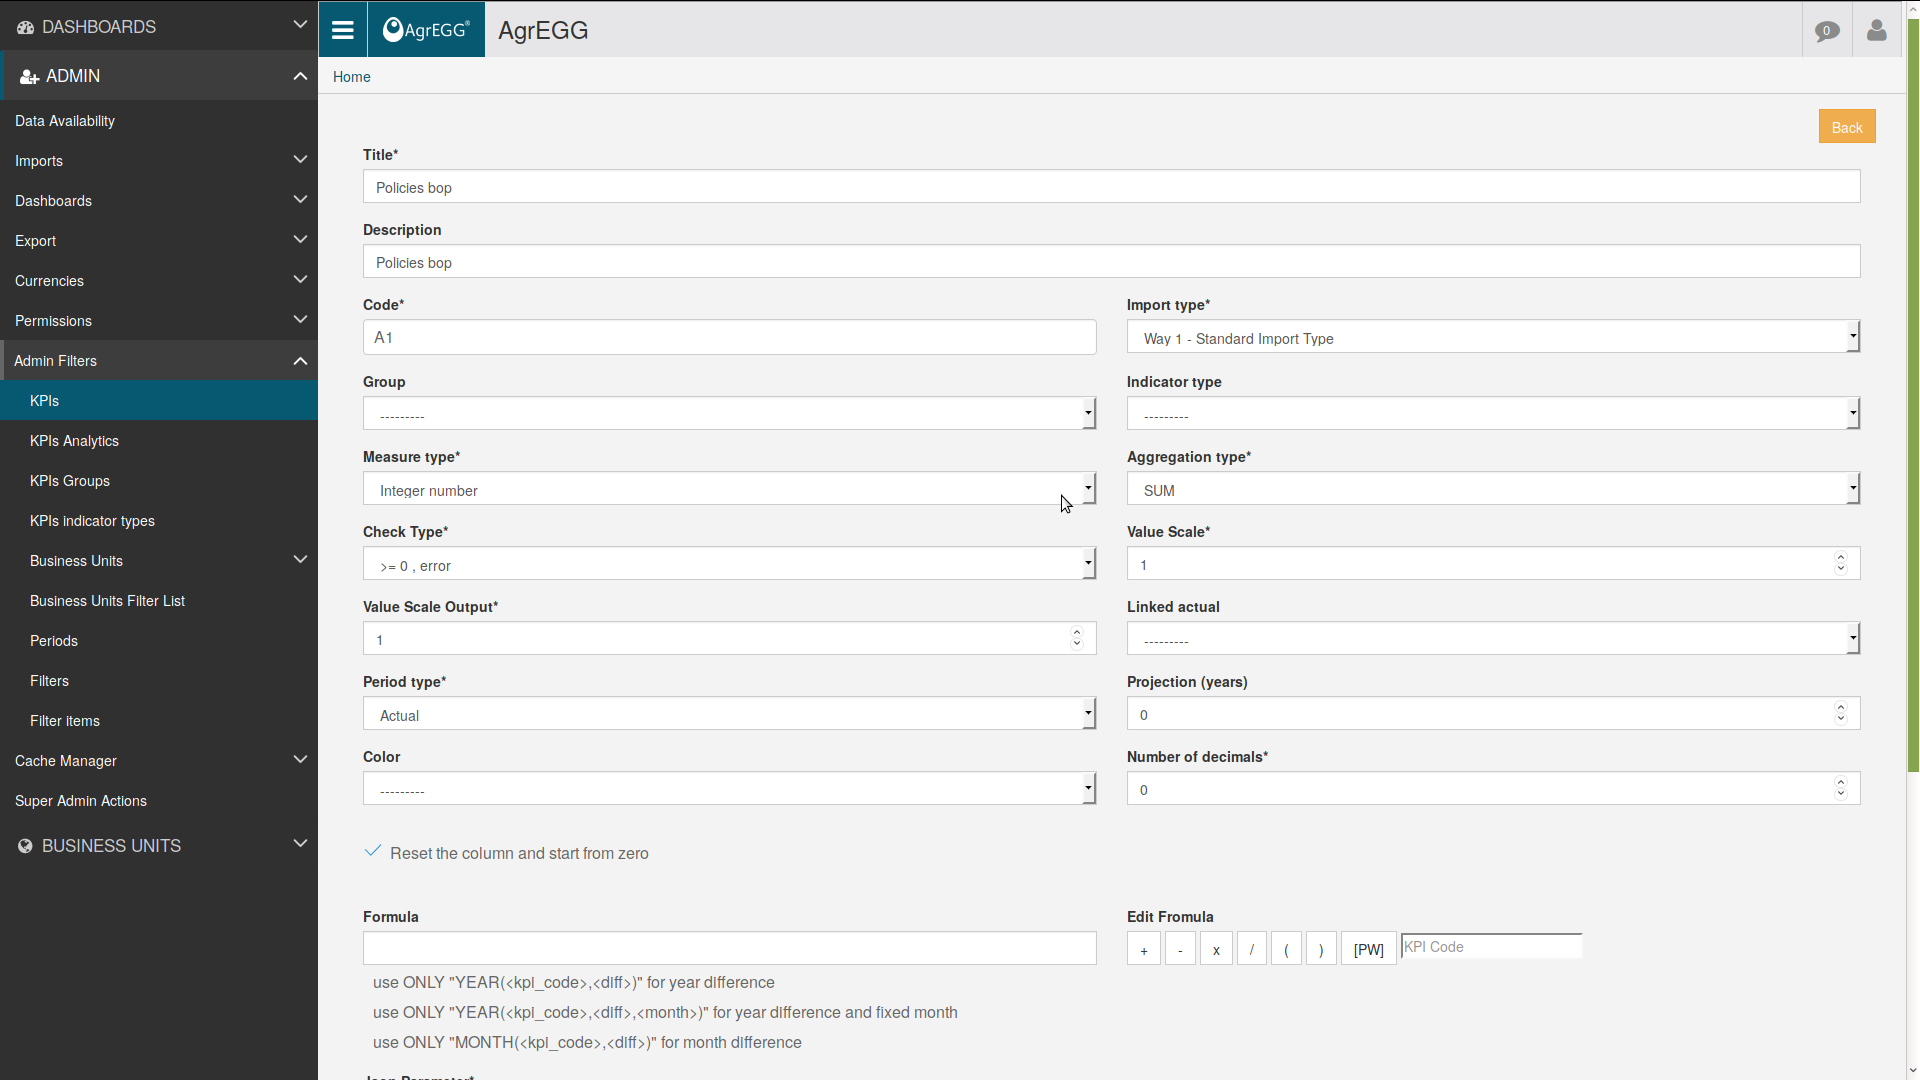
Click “New KPI” to create a new KPI, or “Edit” to edit an existing one, with the following fields:
- Title: human-readable title, optional
- Description: simple human-readable description of the KPI
- Code: univocal string (max 10 characters)
- Import type: select from the drop-down menu the corresponding import type
- Group: select from the drop-down menu (see below)
- Indicator type: select from the drop-down menu (see below)
- Measure type: select from the drop-down menu if integer, decimal, money, or percent
- Aggregation type: select from the drop-down menu how the KPI is aggregated when built from many numbers
- Check Type: select from the drop-down menu what kind of check should be performed on its value
- Value Scale: set a scale (useful for very small or large quantities)
- Value Scale Output: similar as above
- Linked actual: logical link to another KPI
- Period type: select from the drop-down menu if actual, forecast, or target
- Projection (years): if period type is not actual, set how many years in the future the KPI is shown
- Color: when drill-down level is zero, use this color
- Number of decimals: number of decimal digits to show for a decimal number
- Reset the column and start from zero: in advanced walk plot, set if kpi starts from level 0 or is the difference with the previous KPI
- Formula: can be used to create new KPIs starting from existing ones, by use of mathematical formulas
- Json Parameter: additional parameters can be set here
In Json Parameter set the following values to force the calculation in a given way.
{
"gpy":"2",
"period": "all",
"get_all_months_period": True
}
This sums its value for a single year:
"gpy":"2",
"period": "year_2017"
This sums its value for the previous year and for a specific month “pyearm_X_Y” (“get_all_months_period” sets if all months of the given period are considered): X is the number of previous years and Y is the id of the period type
"gpy":"2",
"period": "pyearm_1_12",
"get_all_months_period" : True
This sums its value for the previous year “pyear_X” (“get_all_months_period” sets if all months of the given period are considered):
"gpy": "2",
"period": "pyear_2",
"get_all_months_period" : "1"
This get X year for the same period type (e.g. december) of the latest selected period use before “nyear_X”. With this selection, if you select August 2018, the system will return also August 2017, 2016, …
"period": "nyear_2",
To take all periods before the last selected one, set “period” = “all_from_last”. To take all periods before the laset selected one in the given year, set “period” = “all_current_year_from_last”. To take all periods before the laset selected one in the previous year, set “period” = “all_previous_year_from_last”. To cumulate, set “cumulate” = “true”.
Let’s switch to plots.
This sums a kpi value for all periods specified in “period”:
"gpy": False,
"period": "260"
KPI Groups
Under ADMIN->Admin Filters->KPI Groups you can set groups of KPI.
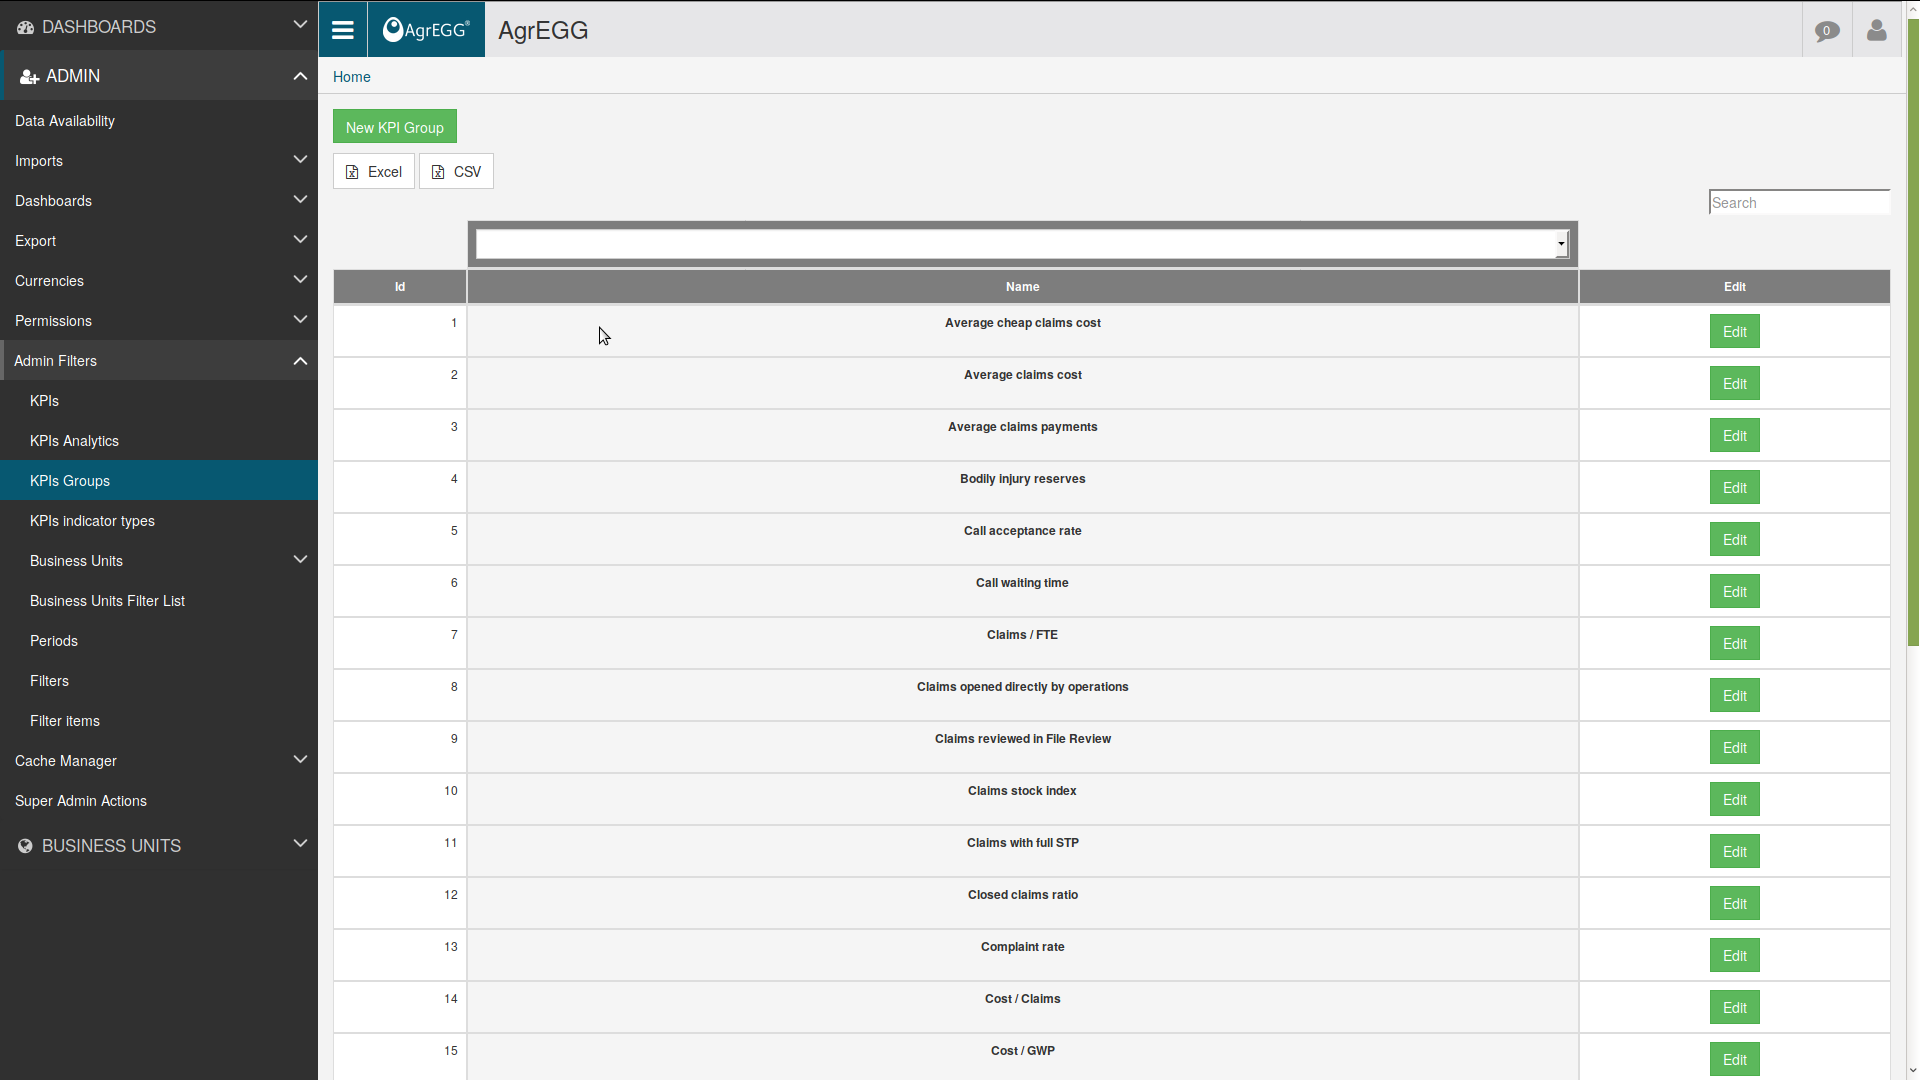

This is mainly for one’s clarity purpose. They can be exported as Excel or csv files.
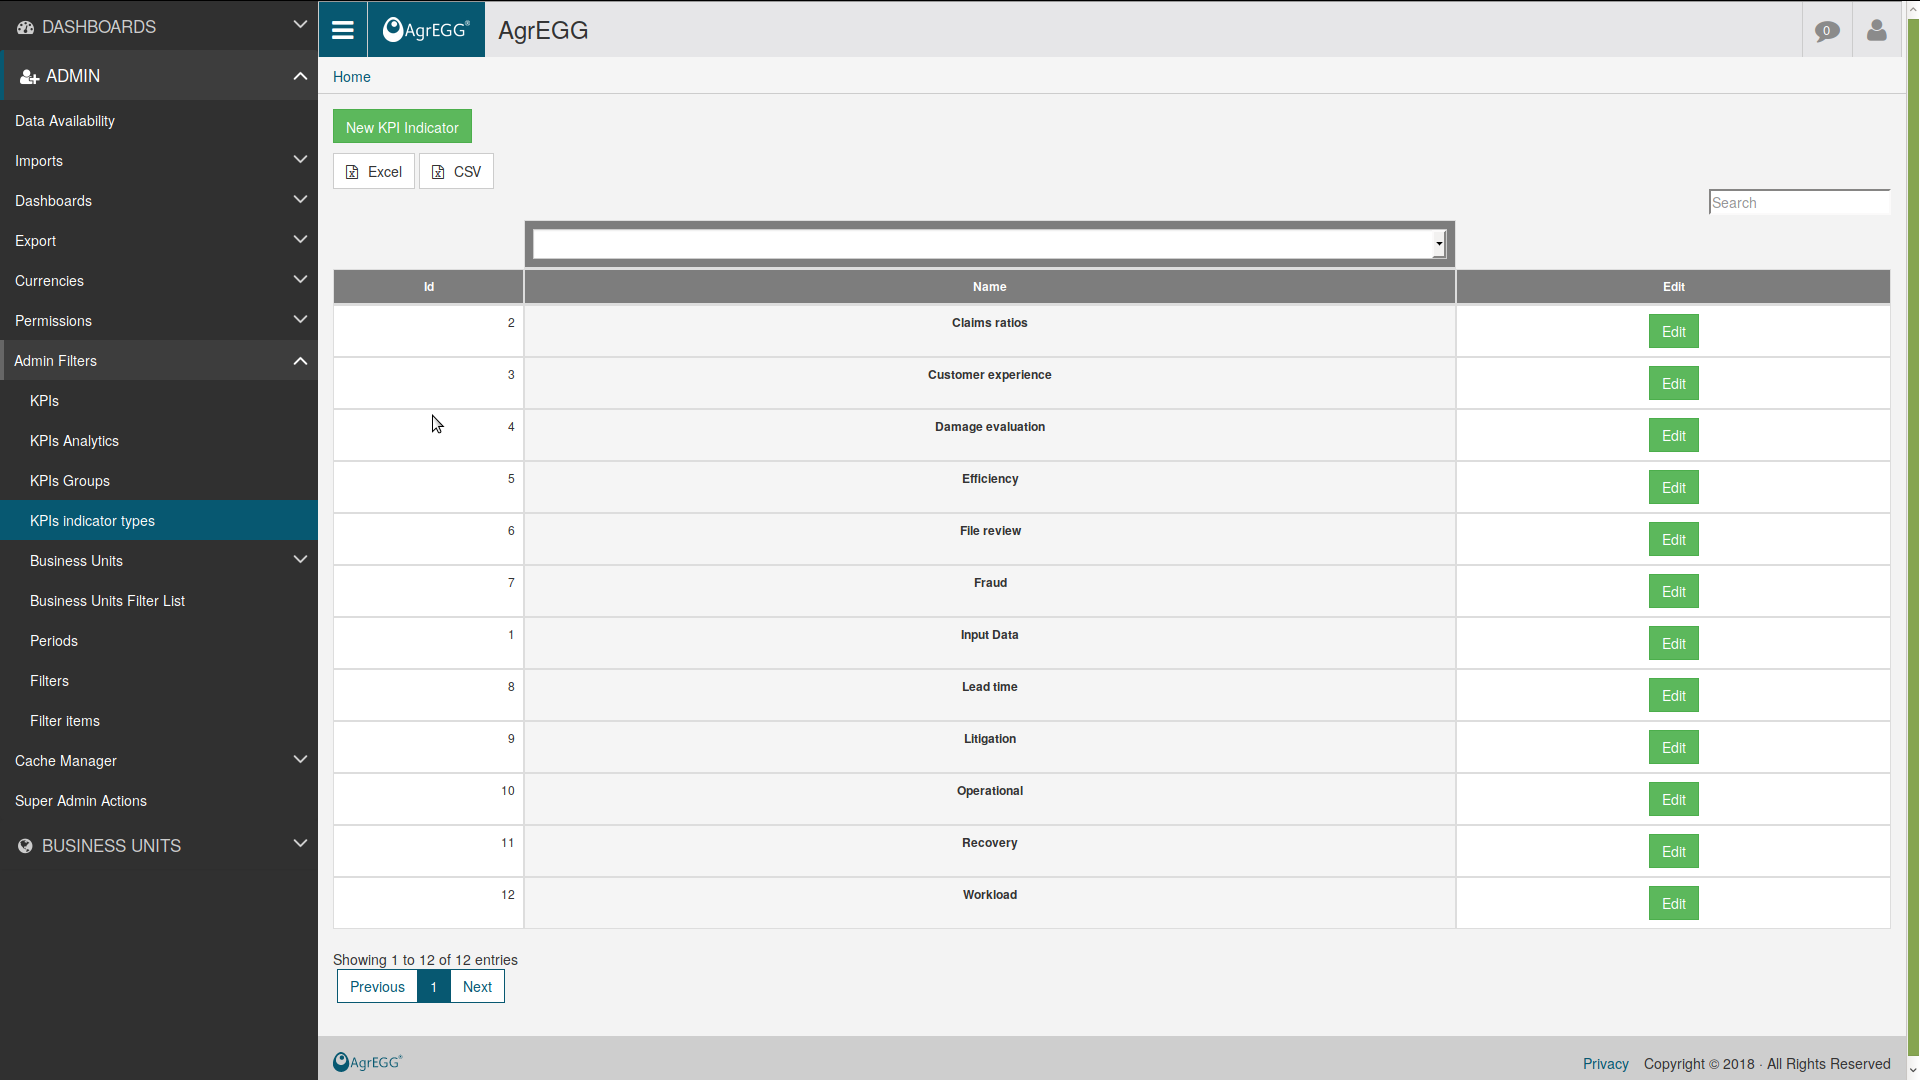
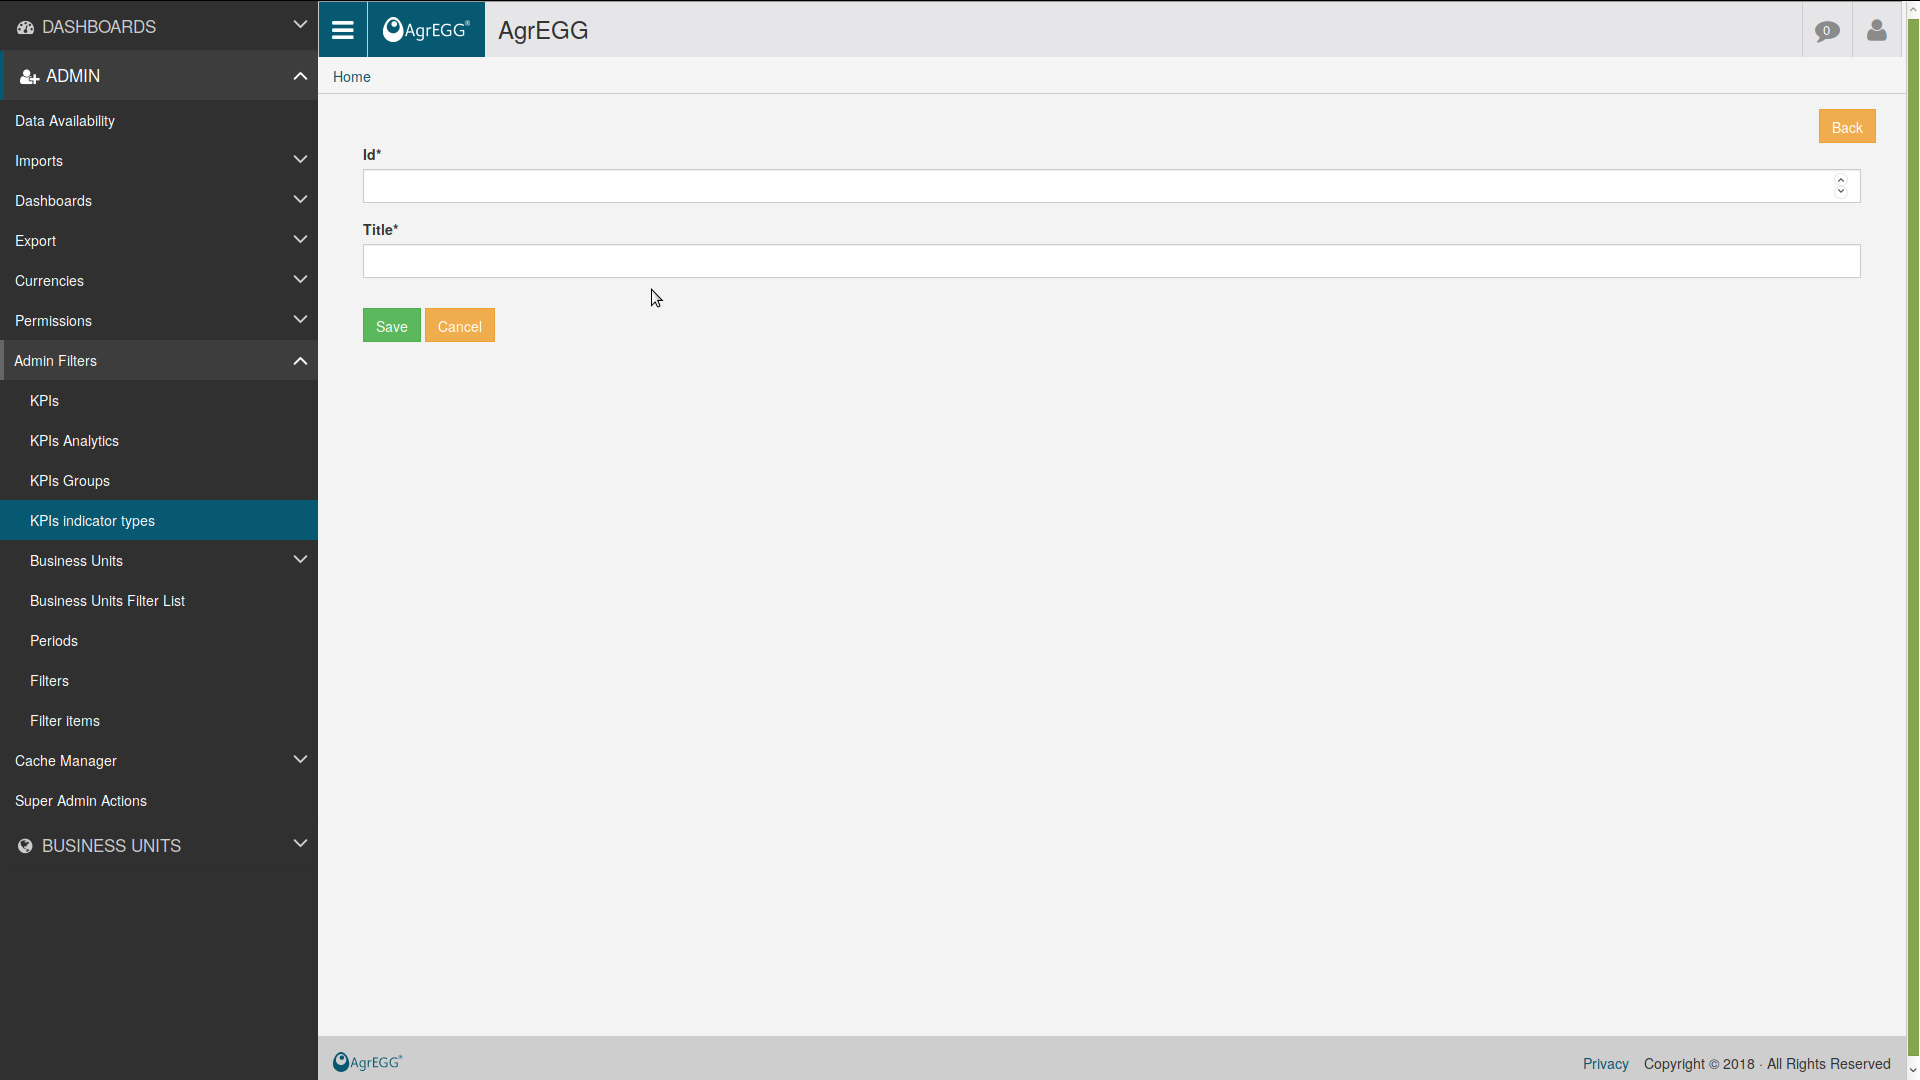
KPI Indicator types
Similarly to KPI groups, one can create Indicator types for classification purposes.