Dashboards
The core element of AgrEGG is the dashboard, where all data are shown to the end user.
So, first of all, one has to create a dashboard.
Dashboard creation
In the left menu select ADMIN->Dashboards->Dashboards:
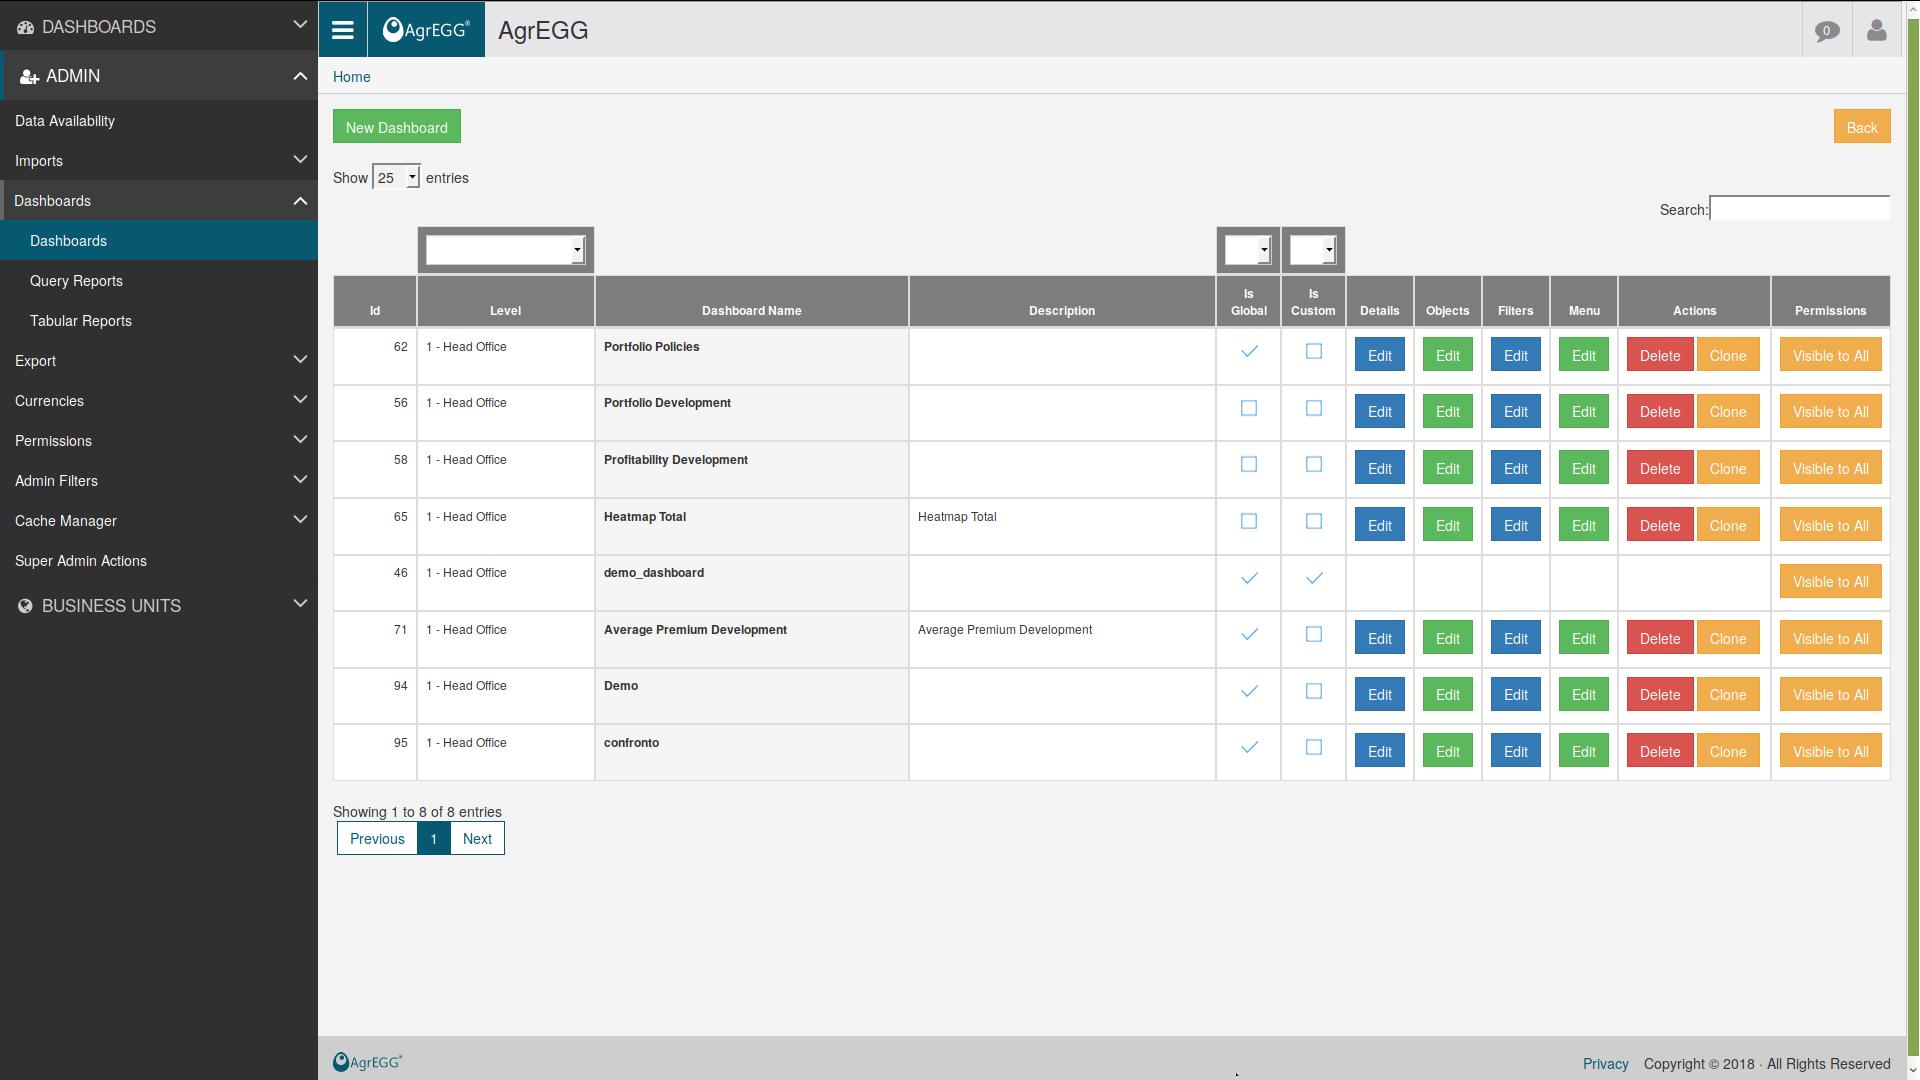
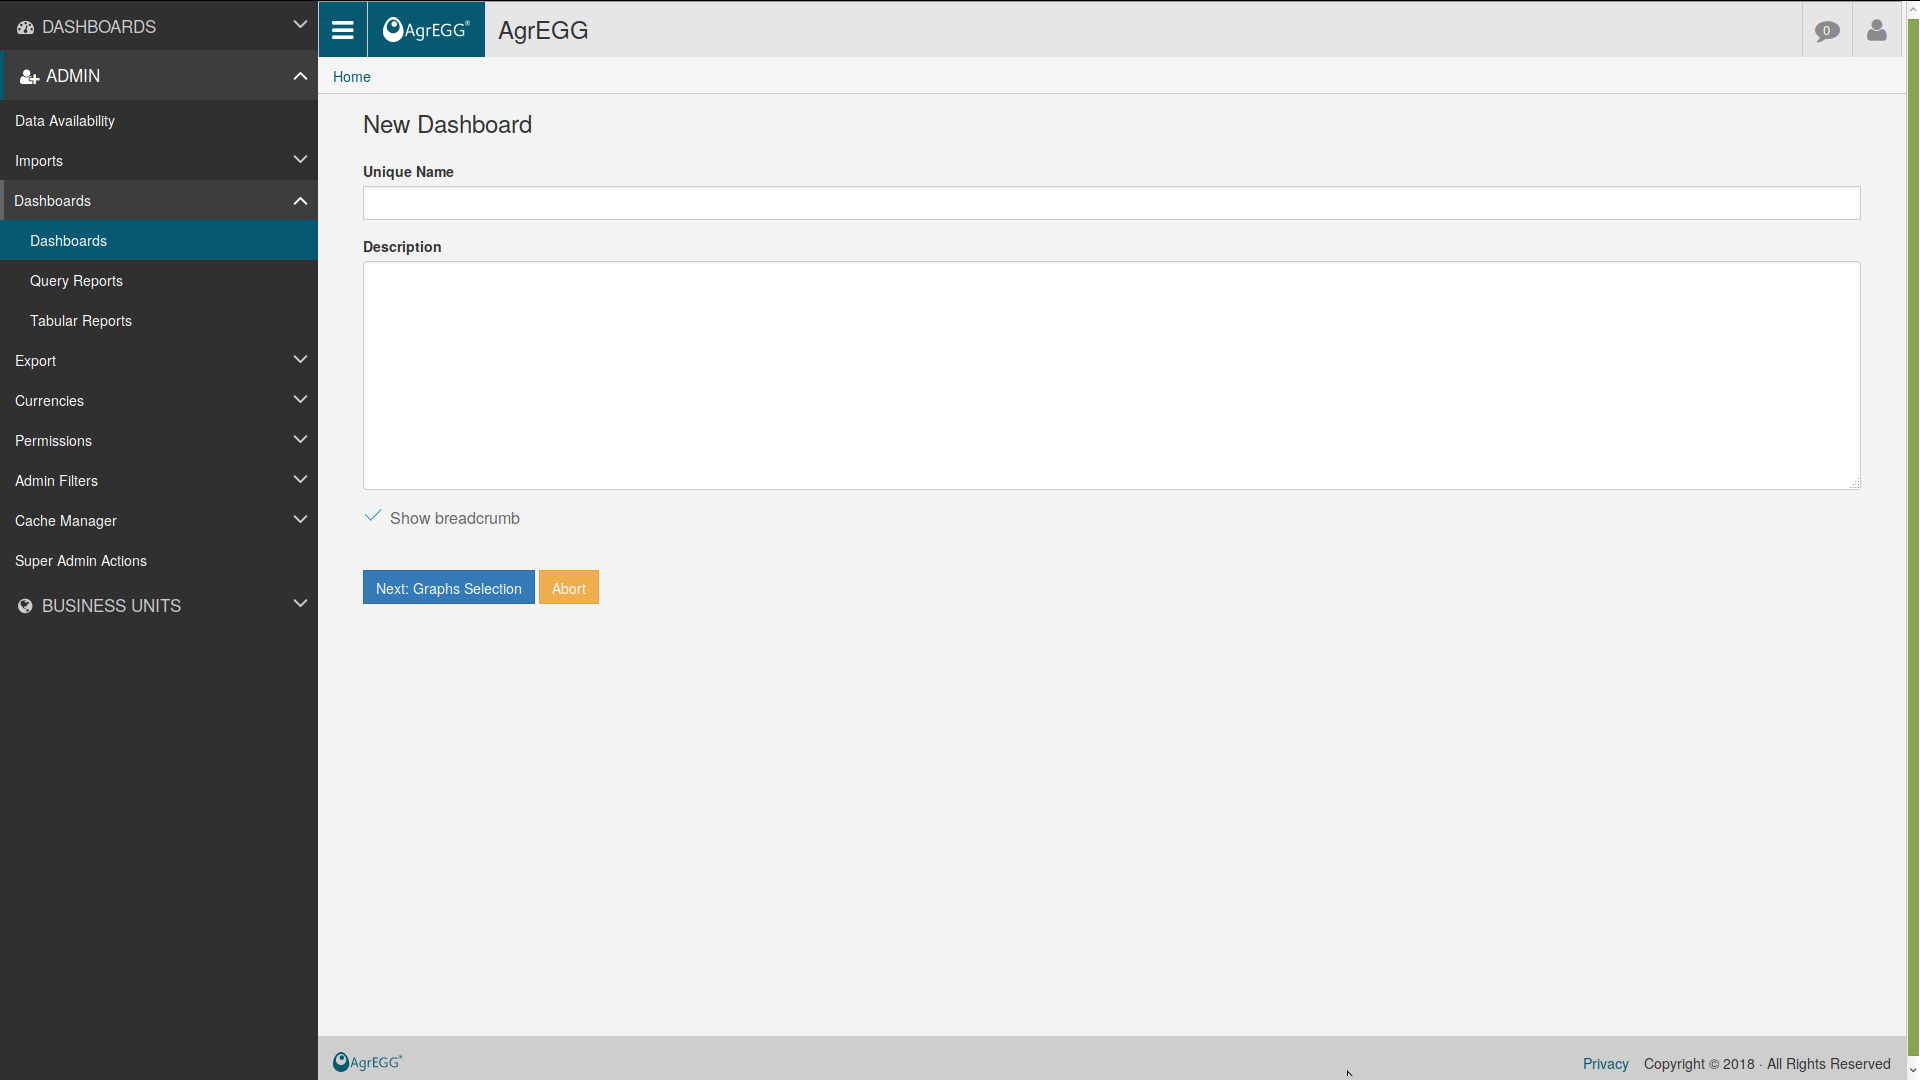
Select an entry by clicking EDIT in Details, Objects, Filters or Menu to modify an existing one, or create a new one with “New Dashboard”.
Dashboard Details
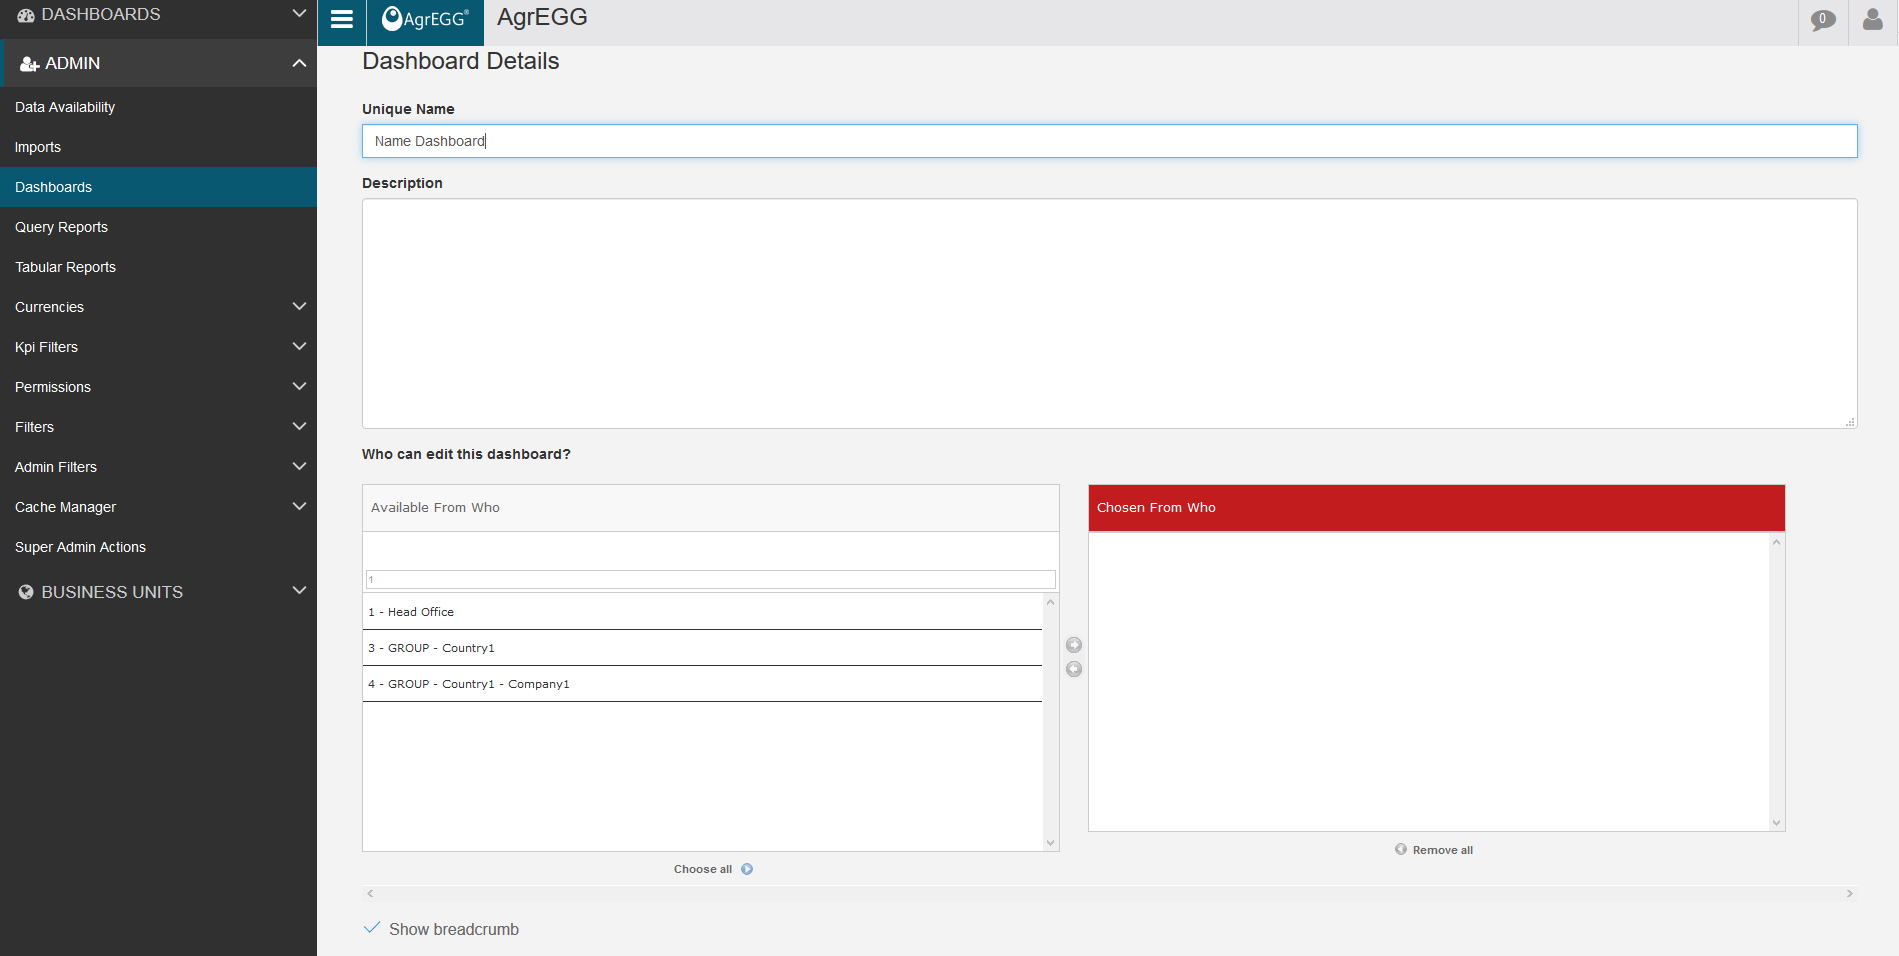
Insert the name of the owner of the Dashboard. It is also possible to add a description and select who will be able to modify it in the business units.
Dashboard Objects
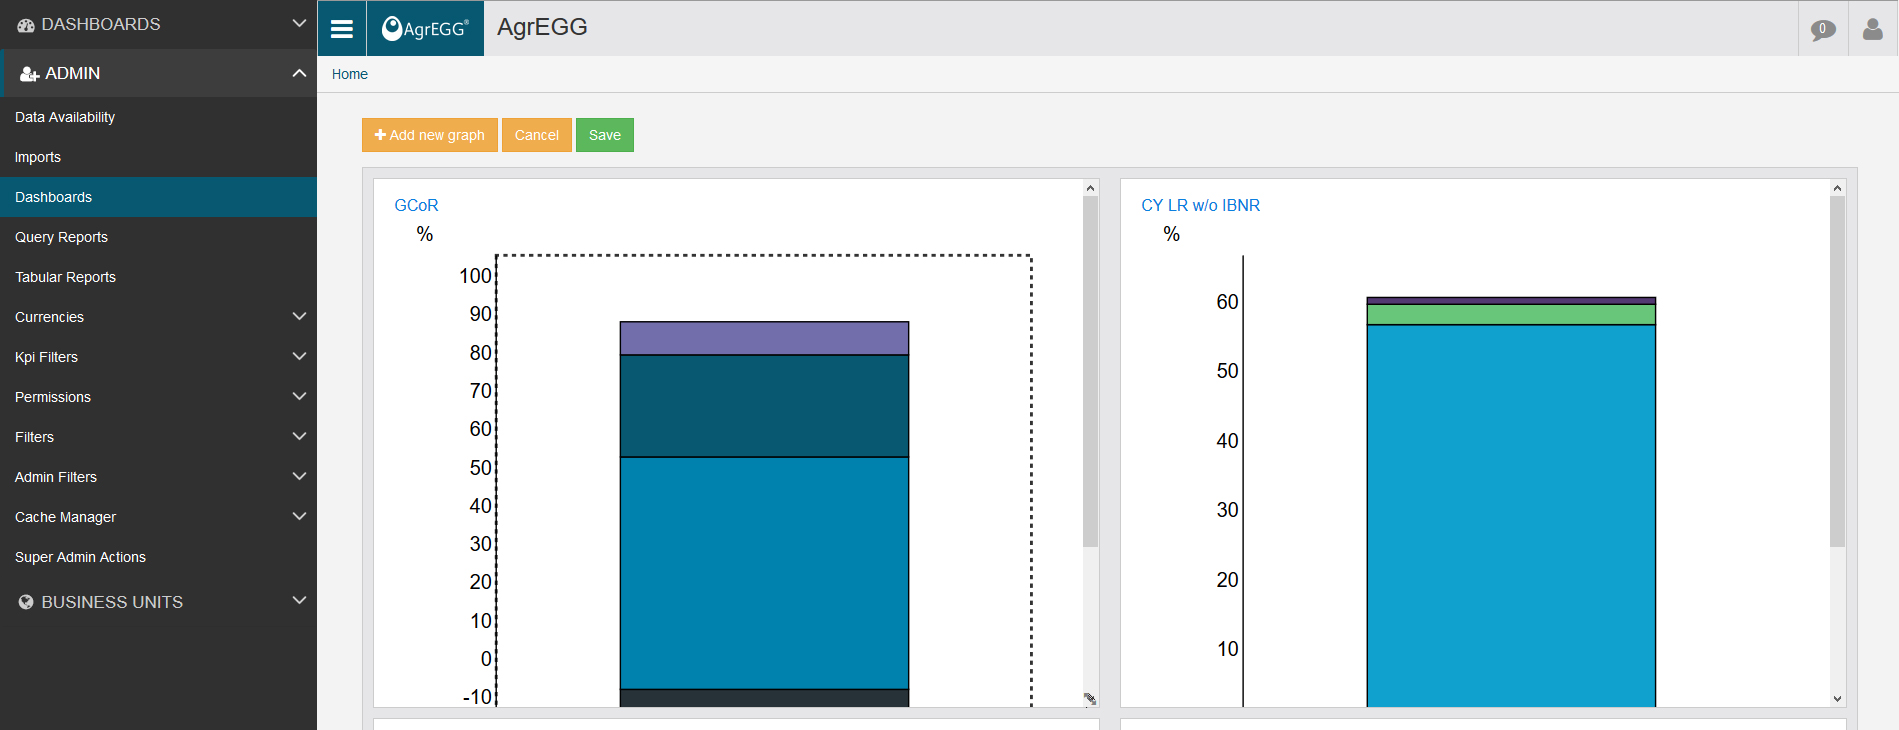
It is possible to add new plots by selecting “Add new graph”. After selecting the plot to add to the dashboard, insert the KPIs to show, the title of the plot, the initial drill-down level and the buttons that shoud be active. At the and press “Save”.
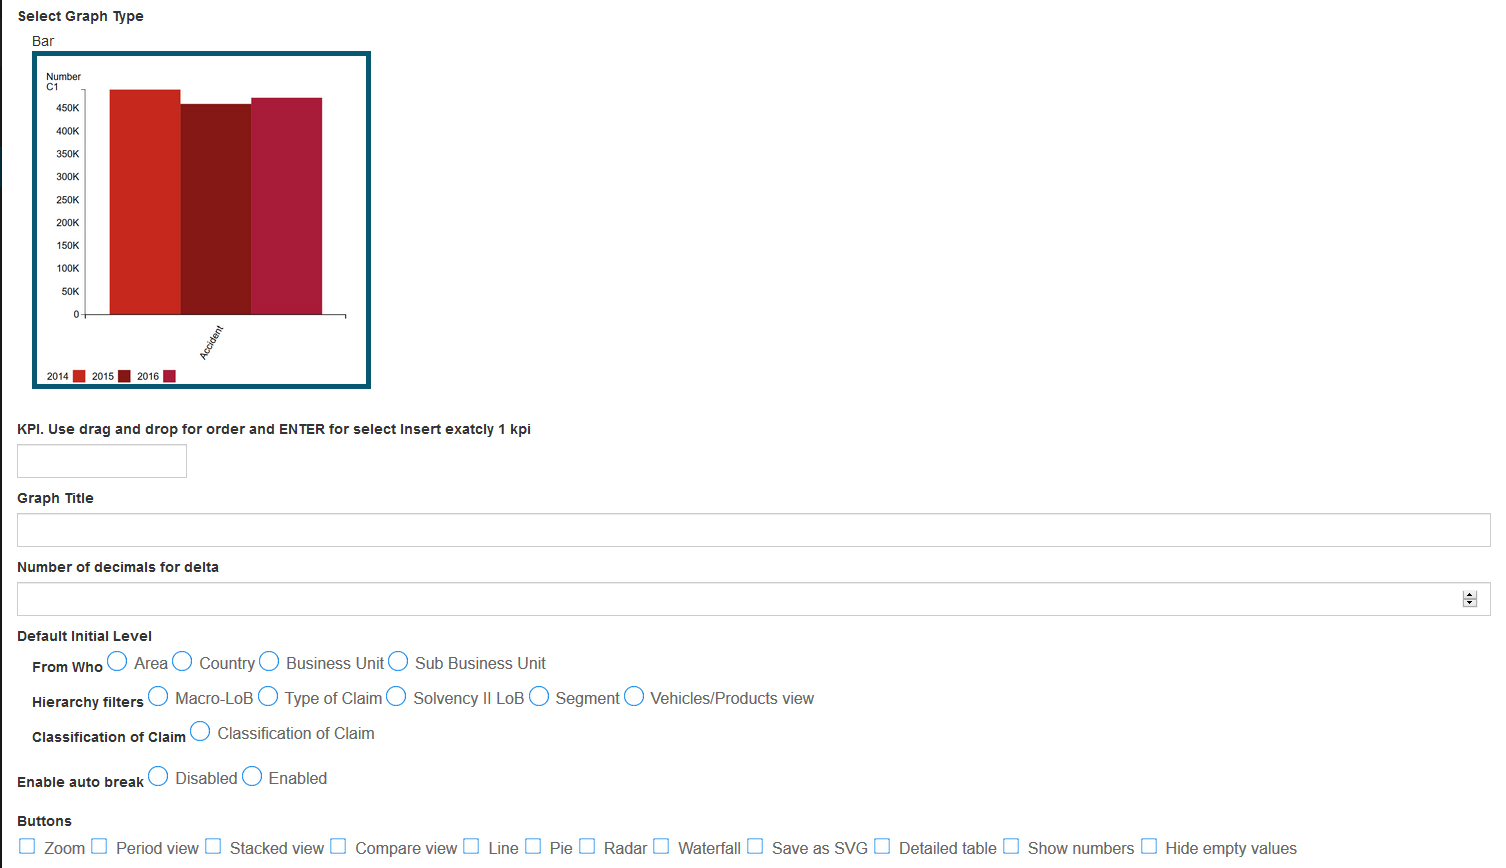
One can change the size of the plot by clicking and dragging the bottom right corner of the plot. The plot height gets automatically adjusted. To modify a plot just click on it. At the end of the procedure click on “Save” at the top of the page.
More details can be found for plots and tables, tabular reports, and query reports.
In extra config you can add a JSON specifications for some type of graphs. For table (last period) you can add : {‘kpi_to_hide’: ‘XYZ’ } if you would like to hide a KPIs but you want to use it for ordering the table.
In Multiple Single value you can specify img path to static for image representative report_id : id of the report pptx to download upload_info : id of the import type upload informations
{‘img’:’logo.png’, ‘report_id’:1, ‘upload_info’: 1 }
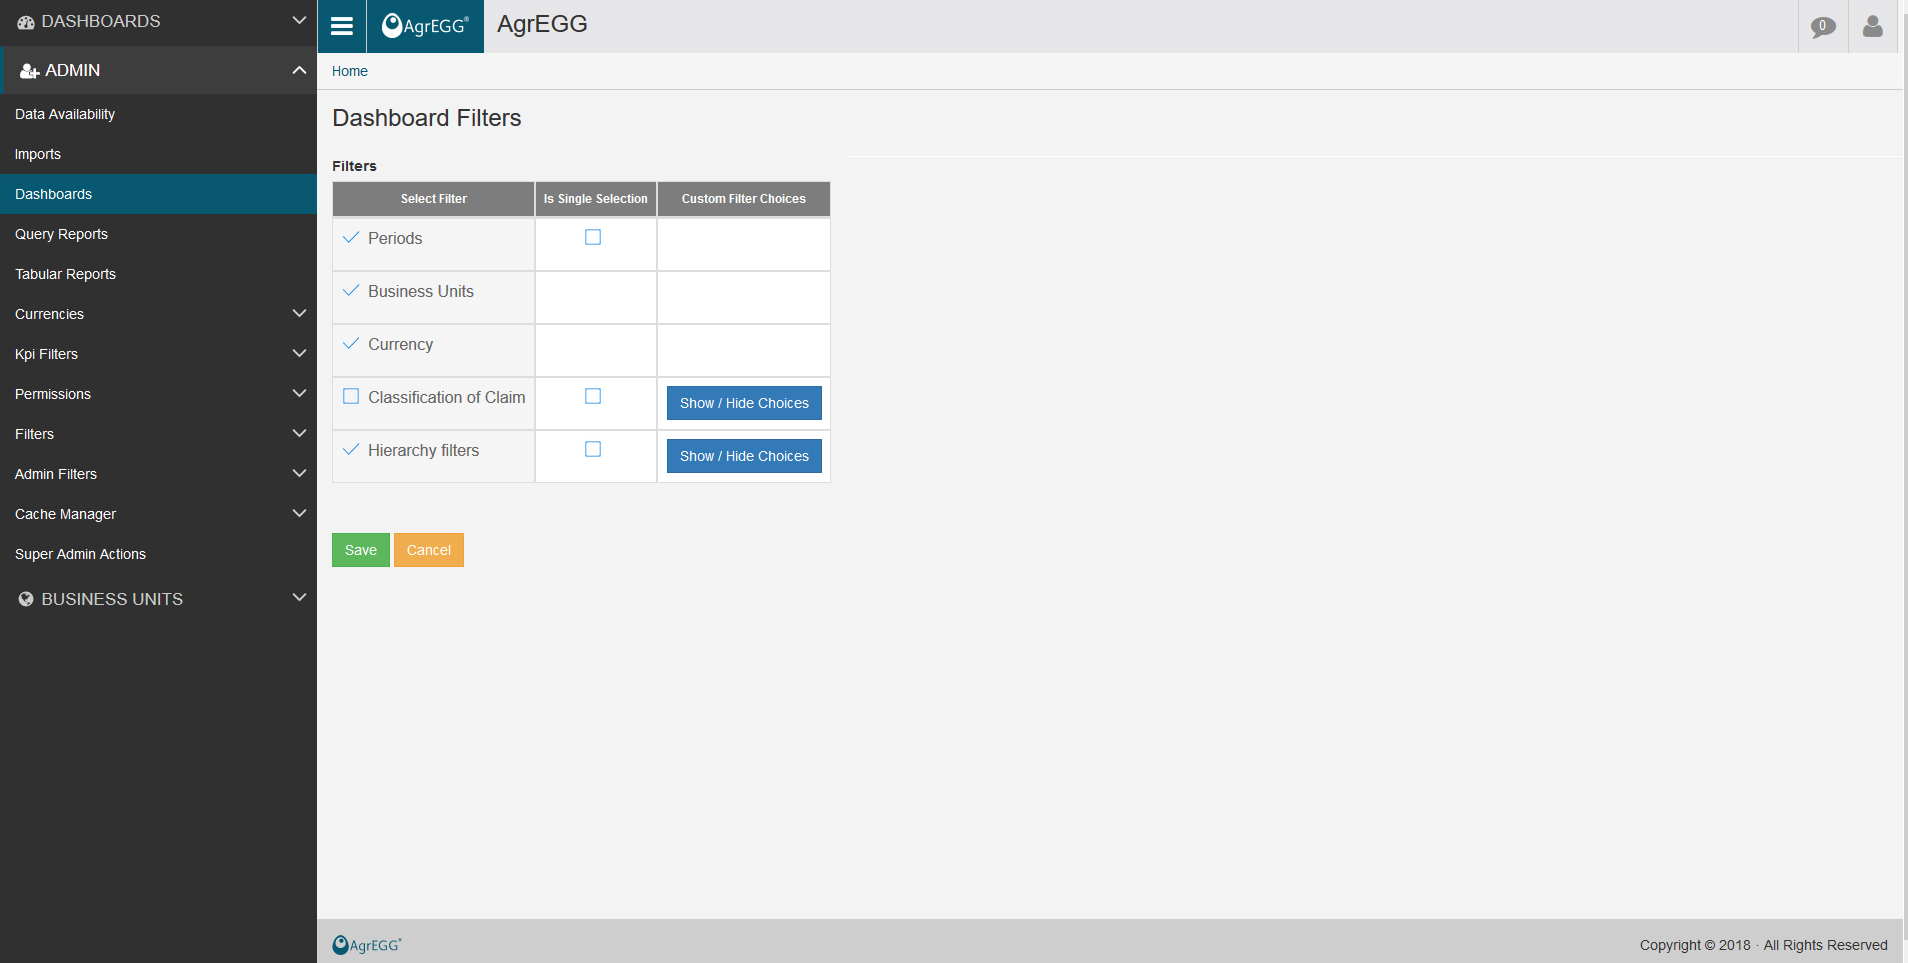
Dashboard Menu
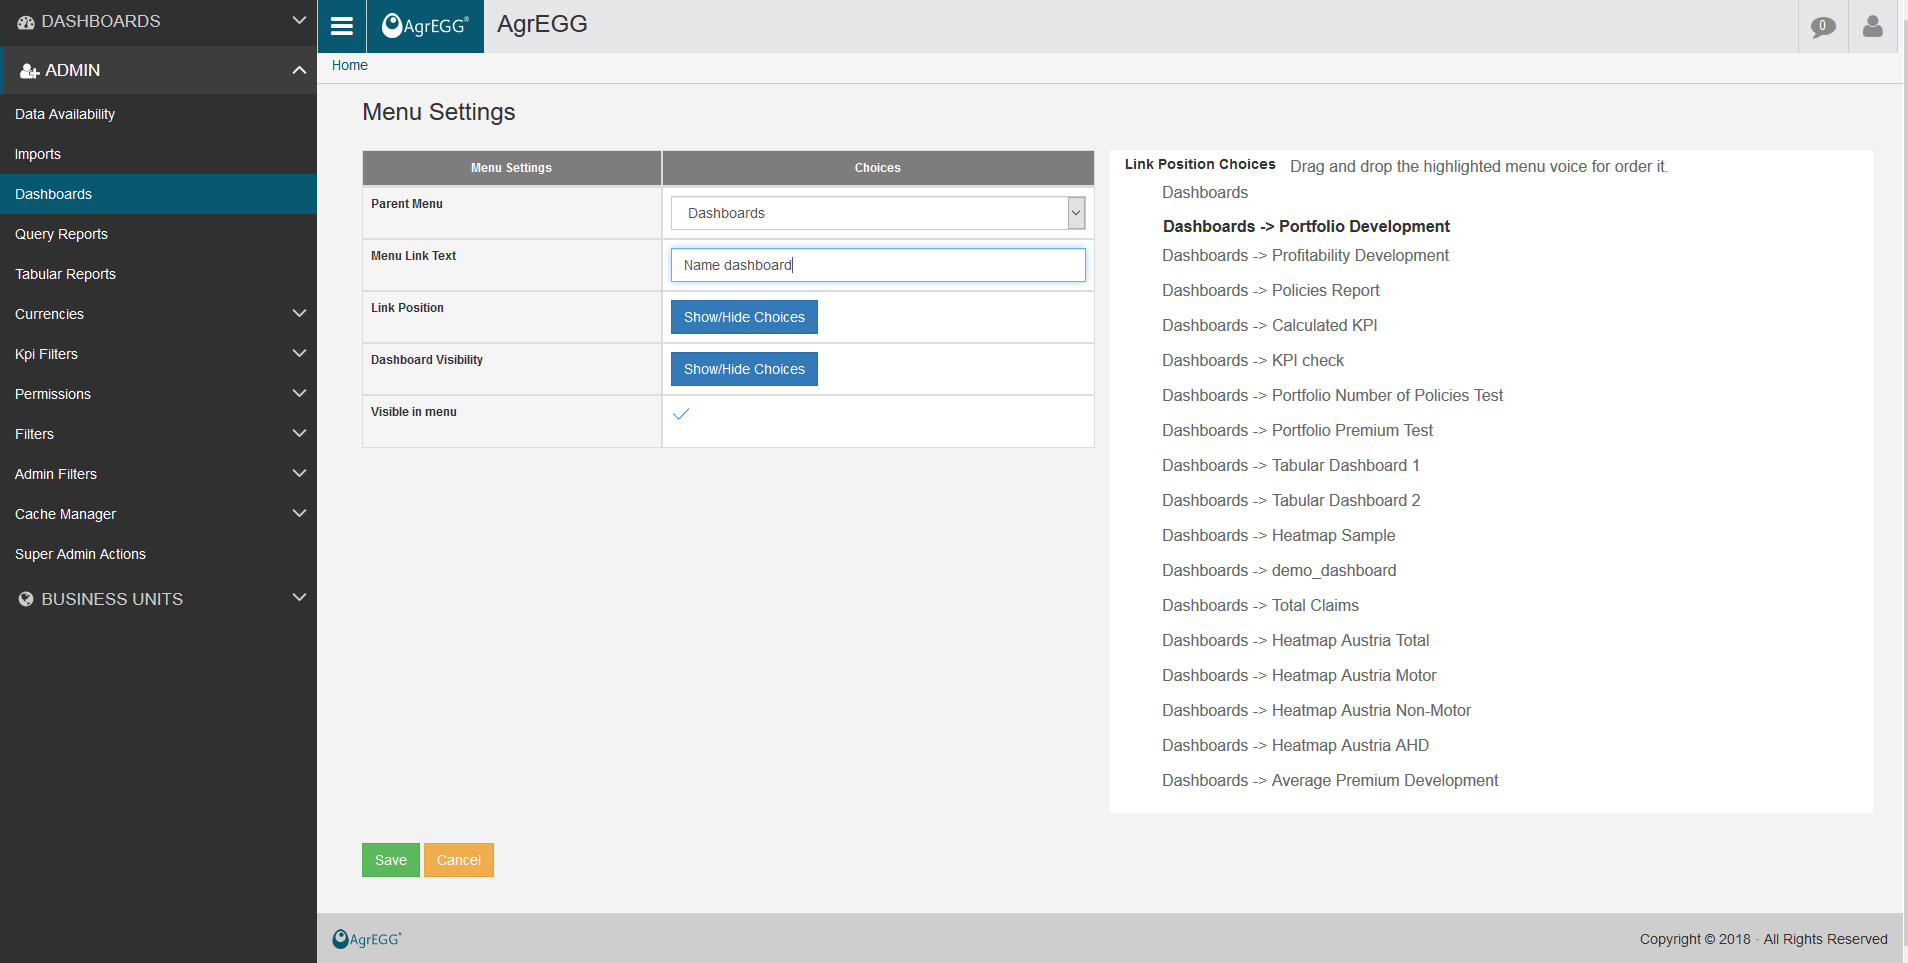
In this menu one can set:
- the parent menu to which the dashboard should be associated,
- the title to show and its position in the left menu,
- the list of groups allowed for access.
Dashboard Actions and Permissions
- Actions: one can clone or delete an existing dashboard,
- Permissions: one can allow different groups to view the dashboard.